


The value of Record-Level Source Data
AGAIN - Aggregate N17-N19 from CDC vs Specific N17.9 from MA death certificates

Some asked how one guy in Massachusetts can possibly show something the world has not yet seen or figured out after 2.5 years. I recently wondered the same thing. I’ve been working for months under the assumption that many must be able to see what I see. I wrote articles on the Massachusetts death certificate data starting with C19 vaccine - the cause of causes published April 12, 2022. I don’t promote myself much and I write under a nom de plume. In August 2022, when I sued the governor, public health commissioner, chief medical examiner, and four individual medical examiners for fraud on death certificates, I came out in public with my name because the alias of “Coquin de Chien” aka “CdC” is in my affidavit that goes along with the Complaint filed in federal court, which is a public document.
To the point, I figured out why I seem to be the only one to find such strong signals and I hope that others can repeat this in every state. It’s very simple. I have source data, while everyone else gets aggregated CDC data that they think is source data. But CDC data is offered in bundles of variables. One cannot mix and match, take percentages of percentages, track average ages of deaths including multiple chosen causes, and perform other experiments.
For example, if I asked someone with publicly available CDC data to give me the average age of those who died with Chronic renal failure, Sepsis, AND Cardiac arrest in the time period September 23, 2017 to April 19, 2021, and with medical examiner license numbers that end in “6” and whose decedents’ fathers had the first name “John,” he or she cannot possibly do that.
Well …
I CAN DO THAT because I have record-level source data. And I have not heard of anyone else who has record-level source data. So this is how some random guy who is just a little above average intelligence can find signals that a world full of scientists cannot find. It’s serendipitous, not genius. I am writing this so that people can understand that we deserve this data. We need to demand this data. In this data is the evidence and proof of “vaccine” deaths and danger!!! And I can pinpoint the specific blood-related causes, not only in a bundled category of “cardiac” like from the CDC, but in specific codes like I46.9 “Cardiac arrest, unspecified” or I49.9 “Cardiac arrhythmia, unspecified.”
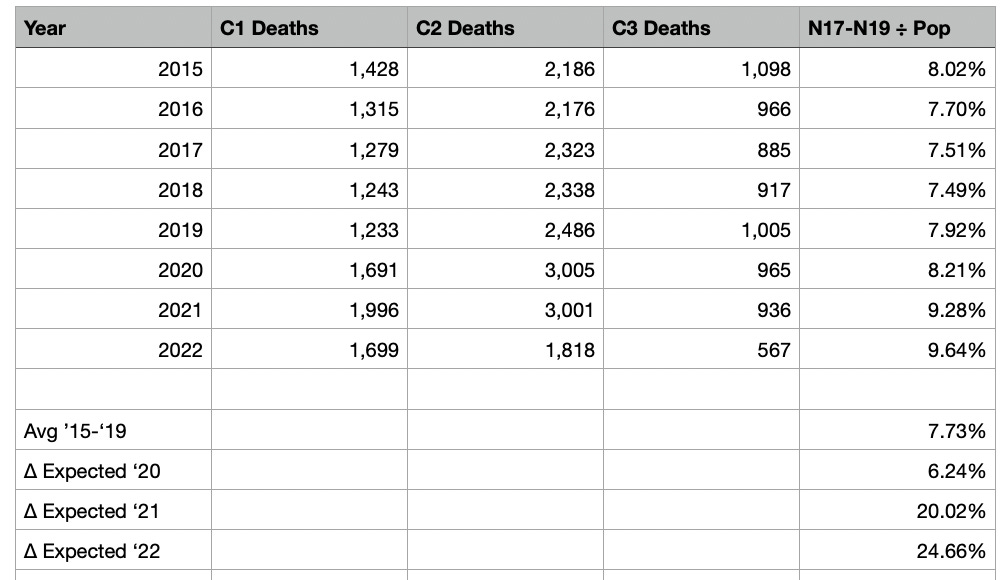
Here’s the same example from the last article, but this time I will use the CDC bundled data to compare. To do this faster and without building more generators, let’s look at everything as a percentage of total deaths. This way, 2022 can be easily compared to the other years even though the data is only provided through August.
Again, instead of comparing chronic against acute like in the last article, let’s look at what CDC actual gives people. This is what you would get from CDC.

From these numbers, you can derive the following increases (signals):
2020 is 6.24% higher than average
2021 is 20.02% higher than average
2022 is 24.66% higher than average
Yes, these are high in their own right, but low when compared to the specific code below of acute renal failure, indicating something is killing people. Remember that “acute renal failure” really means “sudden kidney function failure.” It’s happening in people who did not have kidney disease before and it’s happening suddenly from something. Perhaps it is … Run. Death is near?!
Now let’s look at ONLY N17.9 Acute renal failure again to see if that particular and singular ICD-10 code has a signal bigger than the aggregated bundle that CDC gives to the world.

From these numbers, you can derive the following increases (signals):
2020 is 12.11% higher than average
2021 is 42.58% higher than average
2022 is 84.99% higher than average
These signals are 2X to 3X higher than when someone uses the bundled N17-N19 data from the CDC.
Conclusion
Every state’s citizens need to demand source data, accountability, cessation of this “vaccine,” investigation, and legislation to force the state governments to keep The People informed. If the CDC and state departments of public health already have these analyses that I have done, then they have been lying to the public about the safety of Run…Death is near and the “vaccine.” If they do not have these analyses I have done, then they are incompetent and should all be gutted and replaced with engineers and statisticians who will provide a valuable service to public health instead of being what they are now, which are marketing arms of pharmaceutical companies like Pfizer and ModeRNA. … while The People die in a Death Lottery.
Below are some tables people might be interested in. From this data can be derived percentages of percentages in permutations of codes. Especially notice the AVERAGE AGE DIFFERENCES in the tables.
People are dying YOUNGER and SUDDENLY from treatment in hospitals or “vaccine” clinics and NOT from COVID as you’ve been led to believe.
Lastly, if someone finds a bug in my formulae, please tell me.


Could you possibly publish a guide of how to go about collecting this data. Im in NJ and im a doc . I was dismissed from a major northern NJ hospital for deferring the vax. I would
Love to collect data like this for NJ
The NJ state government and health dept has been derelict
Amazing you are an American hero! RESPECT