
COMBINATIONS using record-level source data
Data hounds - what do you think? Can you do this with CDC data?

The intention in writing this article is to again show the value of record-level source data and get The People to demand it. Let’s go directly to a simple table of combinations.
All data in tables is from the Massachusetts state vital records of Death Certificates
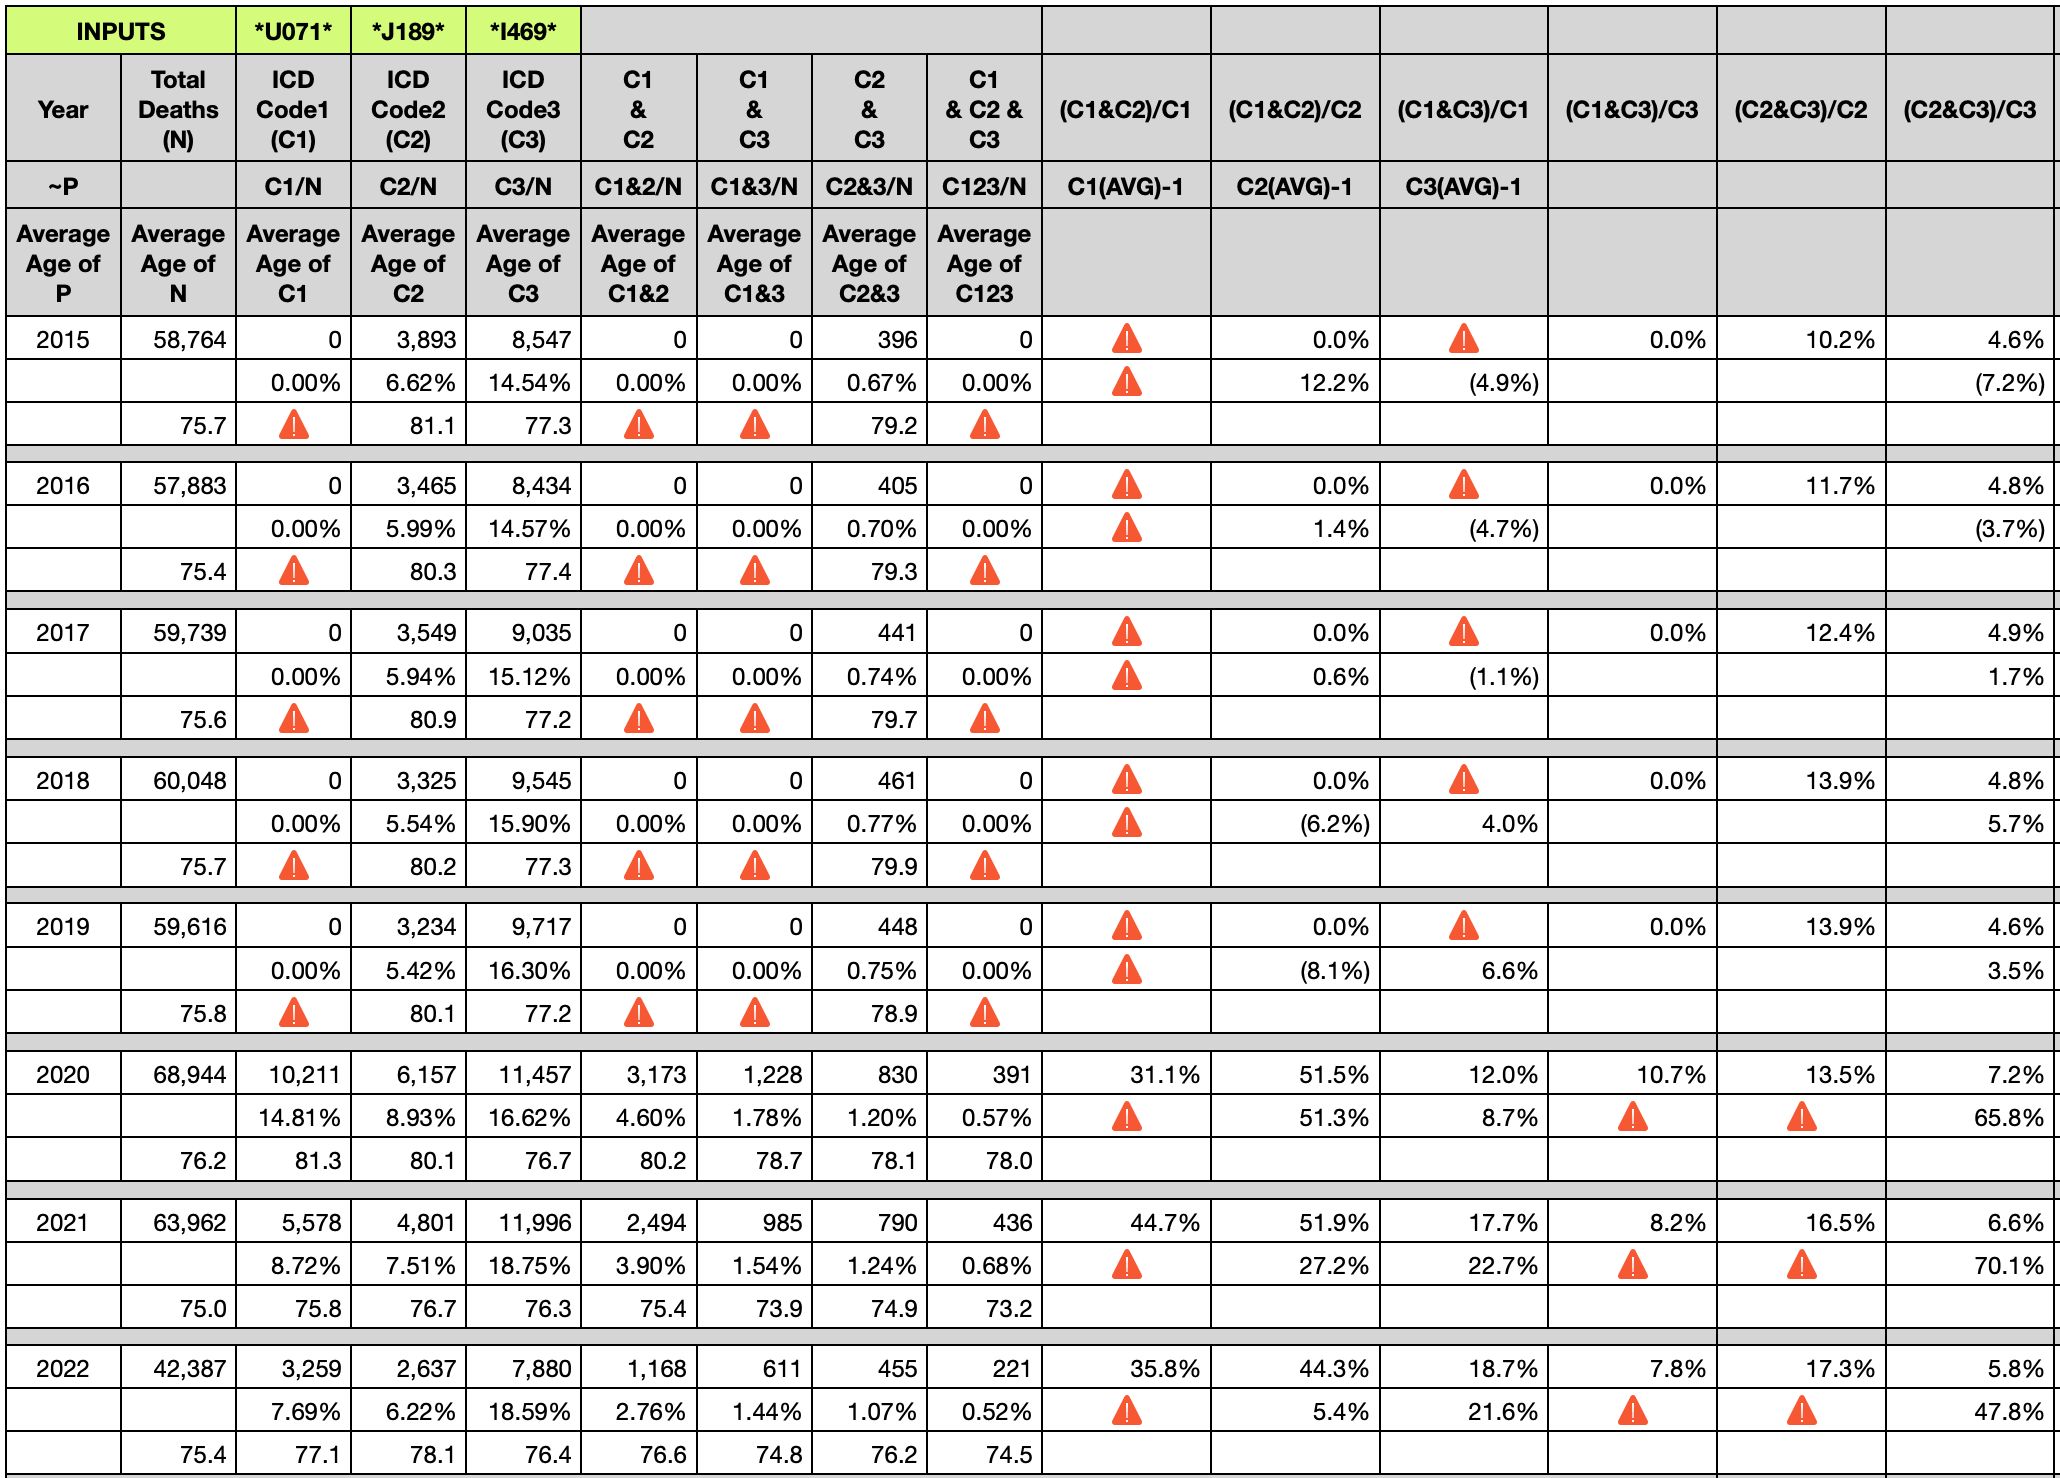
U071 = COVID-19
J189 = pneumonia, unspecified
I469 = cardiac arrest unspecified
N = Total deaths in a year
C1 & C2 means, in this case, those death certificates that include both COVID-19 and pneumonia, unspecified.
C1 & C3 includes, in this case, both COVID-19 and cardiac arrest.
C2 & C3 includes, in this case, both pneumonia and cardiac arrest
C1 & C2 & C3 includes death certificates that include all three ICD-10 codes
The six columns on the right are percentages of combinations.
For example, to know what percentage of pneumonia deaths also died from cardiac arrest, simply divide pneumonia AND cardiac arrest deaths (C2 & C3) by the total of pneumonia deaths (C2). From the table above, years 2015 through 2022 is the following set:
{10.2%, 11.7%, 12.4%, 13.9%, 13.9%, 13.5%, 16.5%, 17.3%}

Why are cardiac arrests increasing as a percentage of pneumonia deaths?
Why did the average age of death involving cardiac arrests drop significantly in 2021 and 2022? Are people having heart attacks and other heart related issues at much younger ages in 2021 and 2022? Notice that I did not include 2020, the year of a massive number of COVID-19 deaths PURPORTEDLY.
If readers are familiar with Coquin de Chien’s articles since March 2022, then you know that there is a change that occurred on a year boundary. Excess deaths switched from being predominantly respiratory to predominantly blood related. Excess deaths also dropped ~ 10 years in age. And the seasonality profile of excess deaths went from cyclical in 2020, like any respiratory virus year, to linear, unlike a respiratory virus, but perhaps like a vaccine roll-out campaign of multiple doses staggered several months across age groups.
Since a few articles dealt with renal failure and noted the value of record-level source data, here is a combination of covid, acute renal failure, and chronic kidney disease.

U071 = COVID-19
N179 = acute renal failure
N18 = chronic kidney disease
N = Total deaths in a year
How can anyone reconcile the DOUBLING of acute renal failure as a percentage of covid deaths, while chronic kidney failure tracked with covid?
Why are so many people dying from N179 Acute renal failure?
85% increase
Analysts, put down the CDC bundled data. It’s been 2.5 years!!!
DEMAND record-level source data!!!
This type of data belongs to The People, not the government. Once the data becomes available, in one week I can show this vaccine to have killed more than 100,000 people in the USA.
There is no privacy in death except where the information pertains to the value of the estate or inheritance to survivors. The vaccination dates, types, and details have no value to the survivors or the estate. THE PEOPLE DEMAND ACCESS TO THIS INFORMATION.
Conclusion
The utility of the world’s statisticians and scientists has been used inefficiently. One person in one week can give an answer that either side should be able to live with. The governments have withheld this information and allowed sides to argue using incomplete and bundled data.
DEMAND RECORD-LEVEL SOURCE DATA NOW.
If only my federal "representation" would actually respond to and act on voter input rather than returning form letters stating "thanks for your opinion, but I'll continue to act in ways that my opinion tells me is in the best interest of my constituents."
Thank you for all the excellent, informative posts. I live in Florida; any suggestions as to what department I can request the data from? Thanks again.