All data herein published is derived from the official Massachusetts death certificate database years 2015-2021.
This article depicts some of the cancer-involved ICD-10 code deaths that increased substantially in 2021.
Introduction
All-cause excess deaths analysis detailed in C19 “vaccine” - the cause of causes clearly shows respiratory-involved deaths dominated 2020 and circulatory-system-involved deaths dominated 2021. The difference between years is stark. If covid killed many in 2020, then what killed many in 2021? Covid didn’t suddenly change from a respiratory virus to a blood system virus.
In this article, cancer-involved deaths are explored. In 2021, the great majority of people in Massachusetts were C19 “vaccinated” early and often. Coincidentally, also in 2021, neoplasm-involved deaths increased significantly as a percentage of all-cause deaths. Certain neoplasm-involved deaths increased more than others and most increased 4 to 6 months after C19 “vaccine” dose 2 distribution, then again after booster distribution.
Adjusting for excess pandemic deaths
One could argue that many elderly people die “with” cancer rather than “from” cancer, especially during a purported pandemic. All-cause deaths in 2020 were up 16.4% over the 2015-2019 AVERAGE and 14.2% greater than the expected value from 2015-2019 TREND (least squares method for linear approximation); and 2021 was up 7.9% and 5.2%, respectively.
In addition to the excess percentage calculated for each type of cancer in the first table, the excess as a percentage of total deaths in a year is also given in the second table. In other words, the difference is given in the first table, then the relative difference is given (relative to the total deaths in a given year) in the second table. This second check offers an additional layer of leather on the aegis against cynics.
The total deaths in years 2015-2021 are {58,764; 57,883; 59,739; 60,048; 59,616; 68,944; 63,893}. These will be used as the denominators to produce the values in second tables throughout this article.
Example:
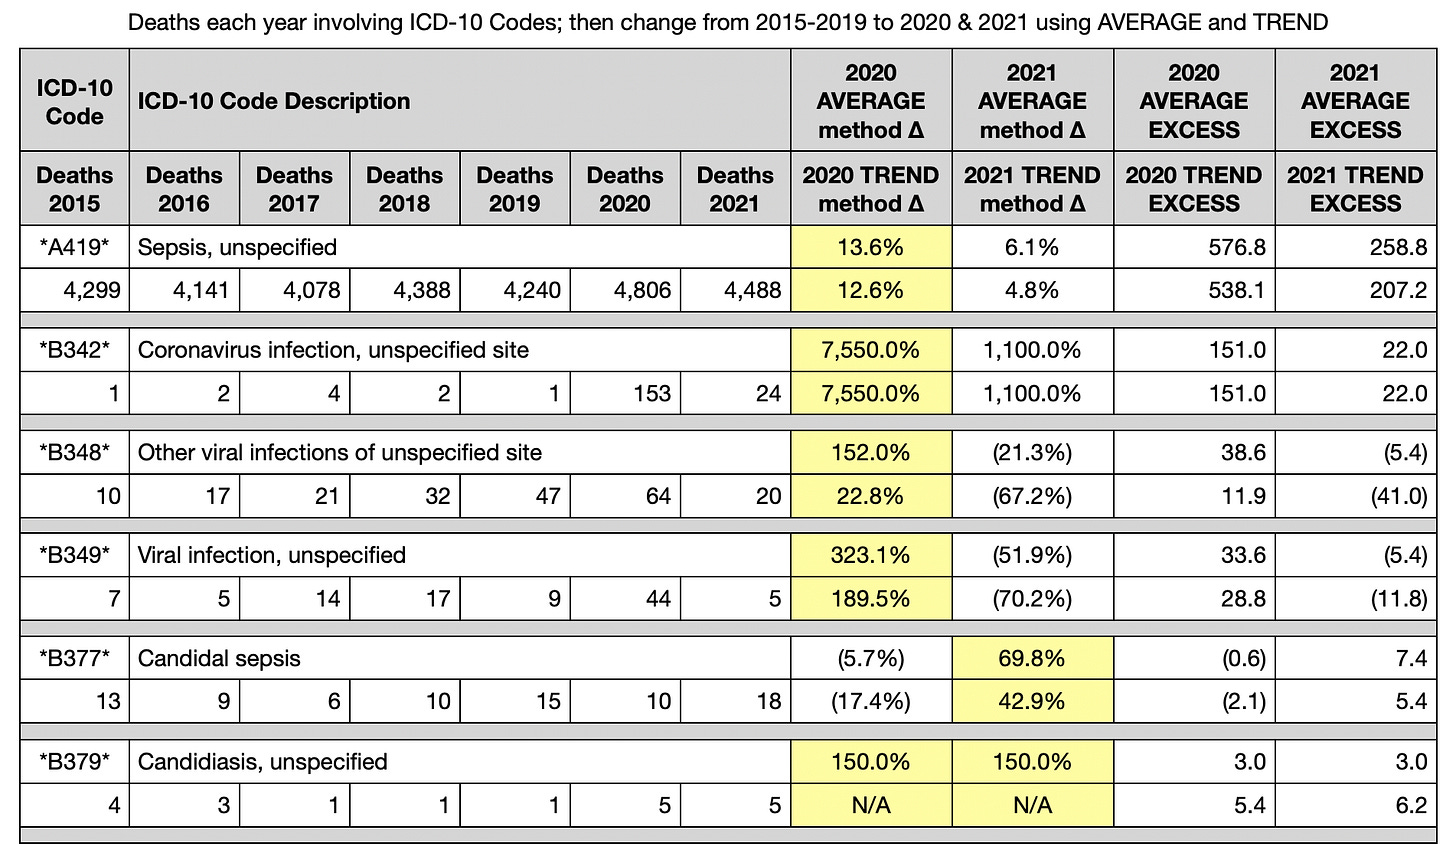
A419 “Sepsis, unspecified” increased 12.6% to 13.6% in 2020, using TREND and AVERAGE methods, respectively. The 2021 increase was 4.8% to 6.1%, respectively.
Each raw data number of deaths involving A419 in a given year is divided by the total deaths that year. The result for each year is a way to adjust for the increased total deaths during the pandemic and check to see how it affects the increase in any given ICD-10 code.
In the second table (above), A419-involved deaths in each year are represented as a percent of total deaths each year. Then, the AVERAGE and TREND methods are used on the percents to calculate the increase or decrease of 2020 and 2021.
Sepsis is a commonly involved cause of death. Thus, in this particular case, the sepsis “signal” disappears when adjusted for greater excess deaths in 2020 and 2021. Both years went from increases in the first table to decreases in the second table.
Before moving to neoplasms, notice also the viral infections in B242, B348, and B349. Perhaps biologists or physicians will contemplate these in relation to how medical coders might use these codes in the circumstance of a negative covid test.
B377 and B379 combine for an excess 10 to 11 involved deaths. These are small numbers, but look very interesting due to a 2020 to 2021 trend reversal from decrease in 2020 to increase in 2021.
C029 to C259
Comments C029 through C259
The yellow highlighting compares 2020 and 2021 to see which has greater increase over 2015-2019. 2021 is clearly worse than 2020. Why?
2021 is significantly greater than 2015-2019 no matter what method is used in almost every category before and after adjusting for excess total deaths (id est, both tables)
Tongue, mouth, under jawbone (submandibular) glands connected to the mouth, and salivary glands connected to the mouth are all up significantly in 2021. Why?
Liver, gall bladder, pancreas, and their ducts are up in raw numbers. There’s an excess 200 deaths involving these causes. Again, why?
C609 to C788
Comments C609 to C788
Setting aside politesse and decorum for a moment - WHAT THE HELL IS GOING ON??!! Why such incredible growth in cancer-involved deaths in 2021?
C780 lung cancer deaths exploded for an excess 134 deaths in 2021. 2020 increased as expected and in line with 2015-2019 after adjusting for total deaths, 0.0% change using TREND to 10.3% decrease using AVERAGE.
Notice C780 lung cancer for 2021 is a massive 20% to 39% increase after adjusting for total deaths. This is a public health disaster.
Large intestine and rectum (from just above) and anus (from the prior tables) point to quite a signal for that bodily system.
Uh … the top one is up significantly. That grew from flaccid numbers. This rise requires three digits to display it.
At this point, the numbers are so disgustingly high that further commentary is left to the readers. There are many hypotheses to be made from these numbers, but there’s one sure thing happening. People are dying in great numbers with many types of cancers that have either been accelerated or seeded by “something” that happened in 2020 or 2021.
C79 to C959
Comments C79 to C959
Glance down the adjusted values of the second table. 2021 is quite bad relative to 2020, the year of the purported pandemic. In fact, 2020’s excess all but disappears when adjusted for total deaths increase. 2021 is still strong with double digit excess.
Many ICD-10 codes are 20% to 100% greater in 2021.
C79 is a higher level category. C795 is included in C79. Notice the C795 numbers in the first raw data table. There are an excess 97 to 142 deaths involving bone and bone marrow alone.
C833 “Diffuse large B-cell lymphoma” has been increasing every year at a tremendous rate over almost the entire 7 years. Will someone study this? Does the Commonwealth of Massachusetts know this? Of course, 2021 is the highest in the set.
C851 B-cell lymphoma is also concerning. Again, what’s going on in 2021?
C795 deserves a closer look
Comments
Age groups 65-74 and 75-79 appear to be the significantly disturbing numbers that are driving the overall increase.
Perhaps the dry tinder of 80-84 and 85+ had been culled enough in 2020 that they only increased at a modest rate in 2021; but then those 65 to 79, who had survived covid in 2020, were taken by something else in 2021. Perhaps something set their bone marrow cancer ablaze. What can do that?
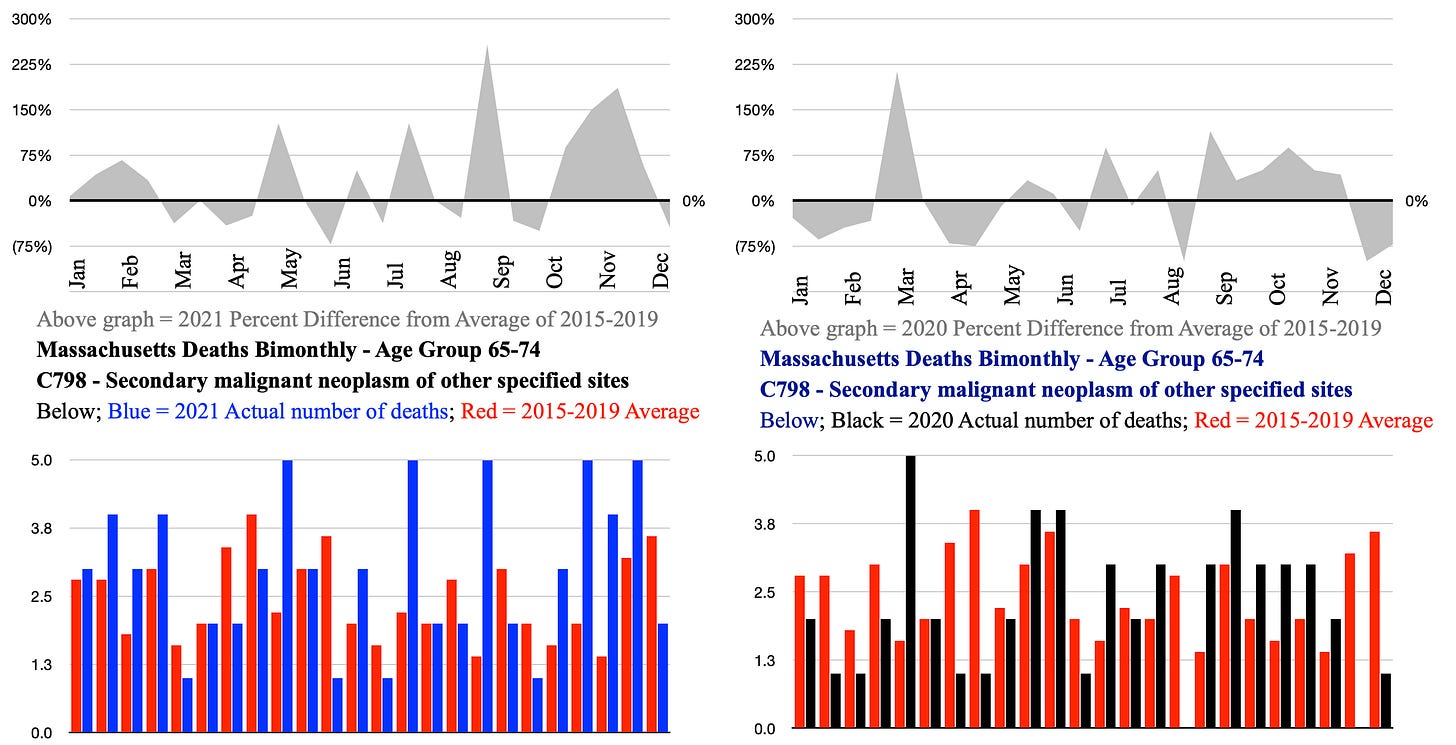
Now that the age group is known, the timing within the years might yield something interesting. Below are graphs of the 65-74 age group for ICD-10 code C795-involved deaths. 2021 graphs are on the left. 2020 graphs are on the right. The top graphs with gray areas are the percent difference from the 2015-2019 averages. Do not misunderstand this. If one of the 24 time periods has a low number in 2015-2019 average and a high number in 2021, then it will look very high in the graph. The bottom bar graphs are the actual values of deaths in the time periods, red being the 2015-2019 averages. The actual numbers are given to understand the reason for the peaks in the gray area graphs above them.
Each time period is a half-month. There is not the adjustment for excess deaths in 2020 and 2021 in these graphs.
Comments
In the top right graph, notice that the first two bumps align with covid’s first wave, which was mid-March through mid-June, 2020. These were likely people perhaps weakened by cancer and taken by covid.
From the end of May 2020 through September 2020 there was not much excess death, which aligns with covid itself.
From the fall of 2020 through January 2021, there appears to be excess deaths involving C795. Again, this aligns with a covid wave, which was quite diminished compared to spring, but perhaps would have taken those immunocompromised from cancer treatment.
C19 “vaccines” were administered en masse in care homes, immunocompromised, and ≥65yo from December 2020 through mid-February 2021. The age group under scrutiny here would have likely had their second doses in early to mid-March.
Knowing that “booster” shots were given to this age group in August, September, and October, the November and December deaths involving C795 are also concerning.
The issue to ponder is whether bone marrow cancer could have been seeded and grown to a point of death in only 3 to 4 months to meet that big May peek seen in the upper left graph. Acceleration of existing cancers is also being considered by many scientists and physicians. Later in this article, the timeline and growth rate of a case will be in vivo shown in pictures. Five months is indeed enough time to seed and grow massive tumors. Given the new phenomenon occurring in 2021 with accelerated cancer growth rate, the significant peek above can most assuredly be considered for causal attribution to the C19 “vaccine”.
D180 to R99
Comments
Most ICD-10 codes in these tables yield low numbers of deaths. Nonetheless, taken together, they depict a disturbing increase in cancer in 2020 and 2021.
Abnormal findings in blood chemistry, lungs, and lymphoid, hematopoietic tissue are significantly increased in both years, but especially in 2021.
NOTE:
R99 is a placeholder for “pending” results. As you can see, this represents greater than 1,000 excess deaths in 2021. This means that these 1,000 deaths will be spread across various ICD-10 codes. These could possibly increase circulatory system, acute renal failure, or cancer deaths by tens or hundreds of percent above values expected by TREND or AVERAGE.
Promised evidence of tumor growth, acceleration, and timing
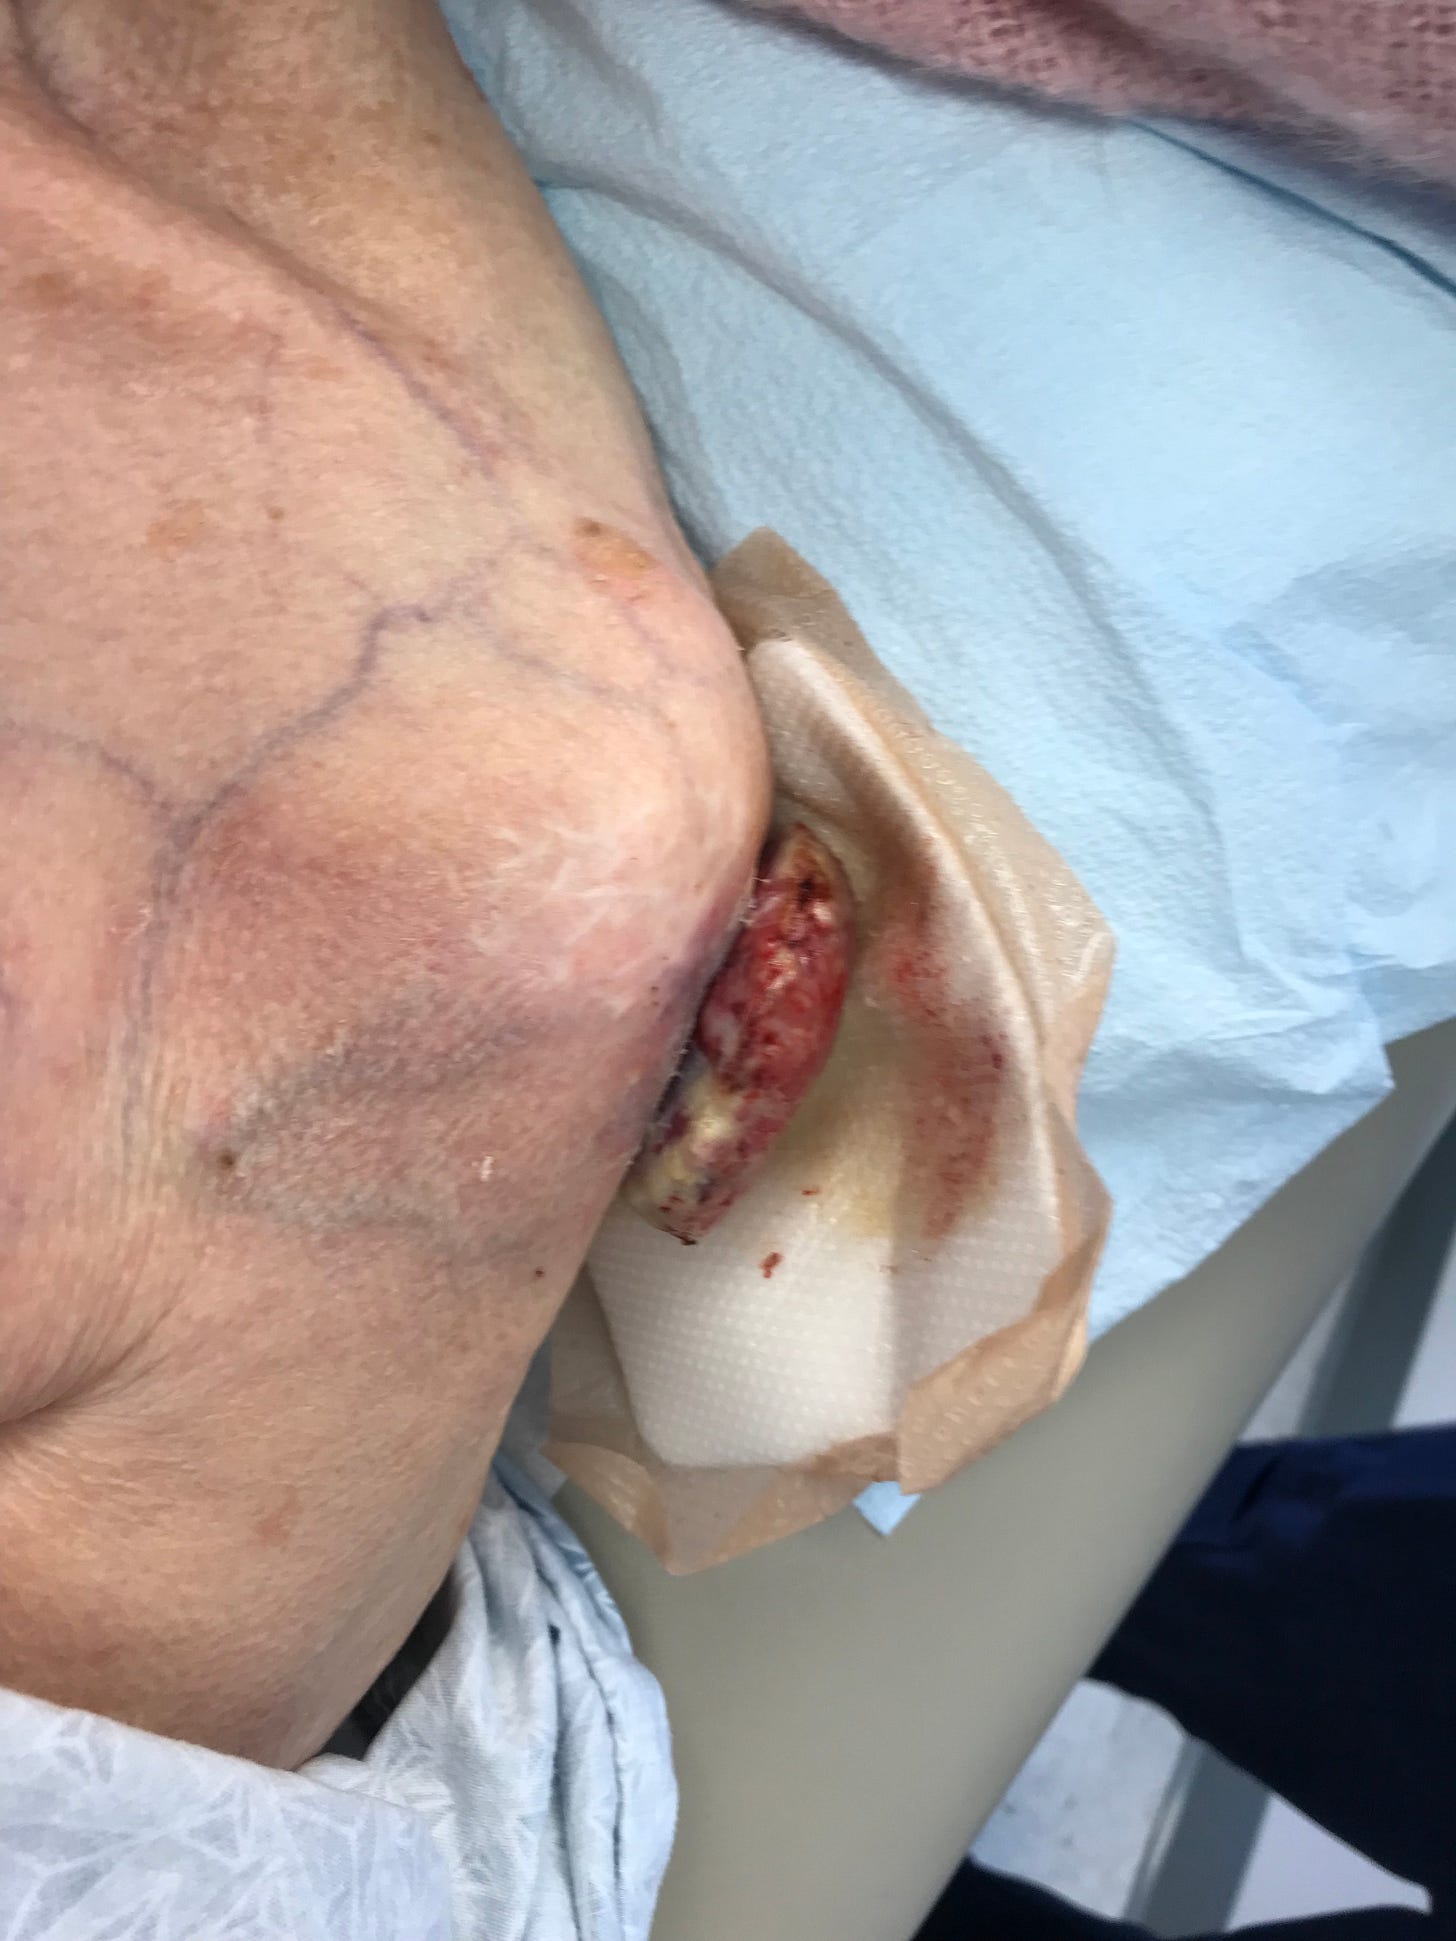
The above picture is the left shoulder of a 92yo woman. The person who took this picture is a close personal friend of Coquin de Chien and son of the woman in the picture. Id est, the chain of custody and facts surrounding this subject are known beyond reasonable doubt. The photographer asked if the tumor may have been caused by the C19 “vaccine”.
The deltoid is the site of injection for C19 “vaccination”. The deltoid site of injection is from whence this tumor burst forth. There are no incisions in the skin. The bandage was removed in order to take the picture. In other words, this tumor was growing outside the body and fed through a hole in the dermal layers for months.
Dose 1 was given to this woman in January 2021. The picture was taken in July 28, 2021. She died August 18, 2021 from other causes.
One may ask, “What are the odds of a malignant tumor growing to this size from the injection site of a “vaccine” given only 5 or 6 months earlier?” Before considering that question, another factor should be considered.
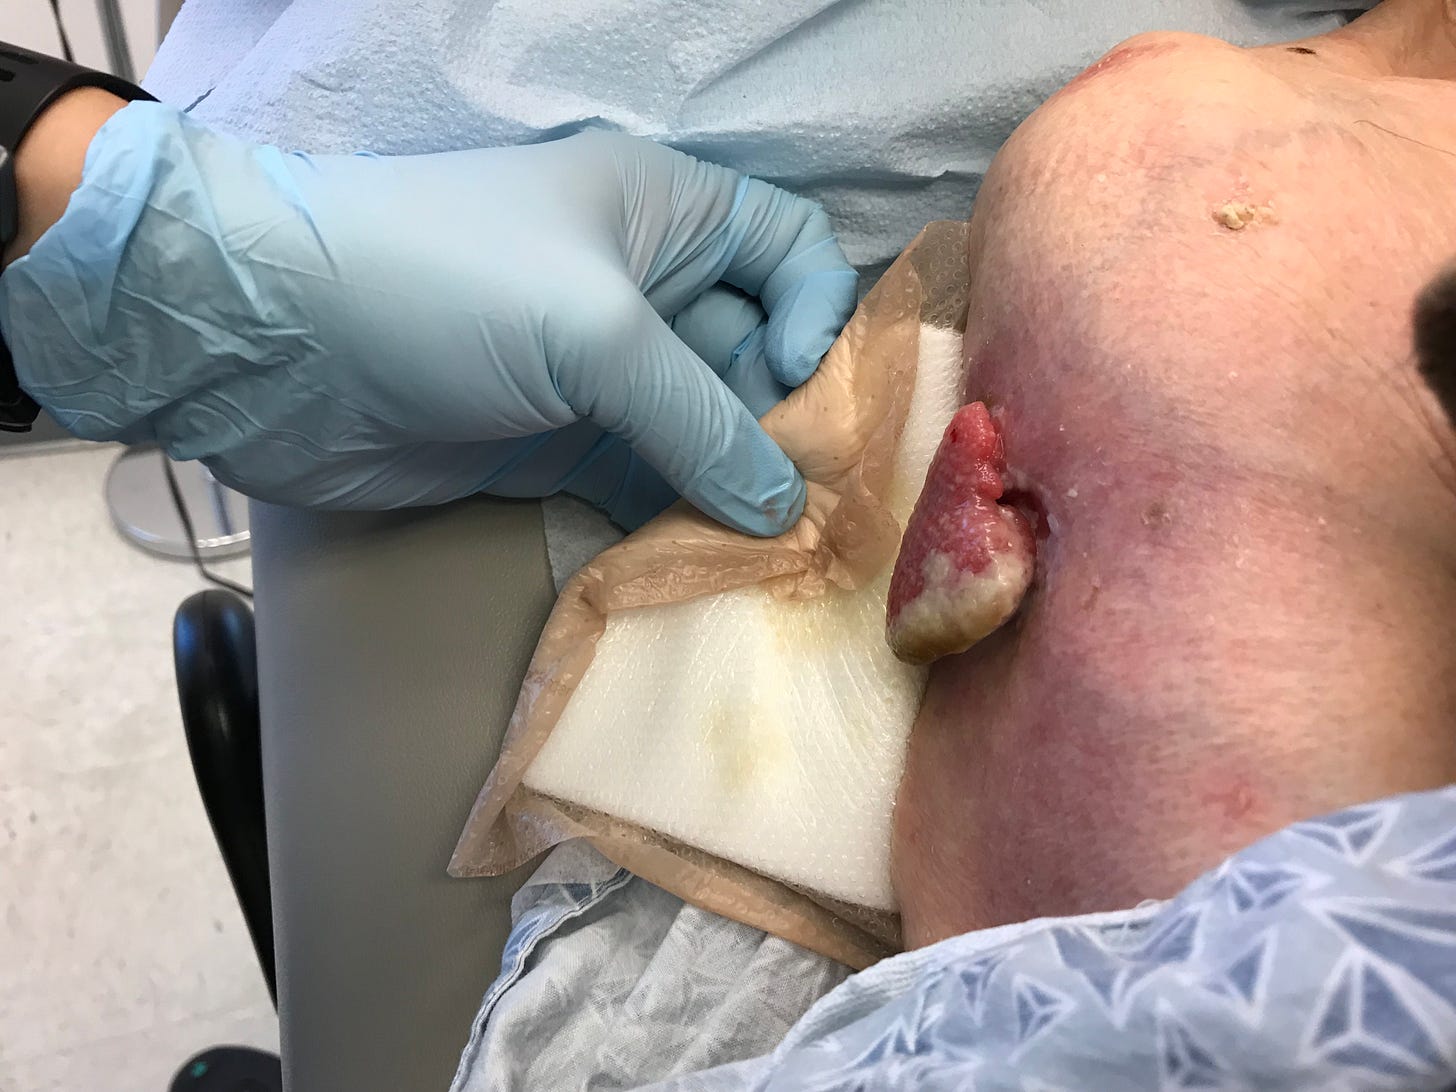
Below is the right shoulder of the same 92yo woman. This picture was taken at the same time by the same person. Yes, you are reading this correctly. She had another tumor from the injection site of Dose 2 of the C19 “vaccine”, which was given in February, 3 to 4 weeks after Dose 1. The woman is 92yo. The injection was given February 2021. The picture was taken July 28, 2021. She died August 18, 2021.
Now, ask the question. What are the odds that the C19 “vaccine” is causally related to the two tumors that started and then grew to massive size from both injection sites over 5 to 6 months since injection?
Strong evidence of the probability of seed and growth of tumors was offered earlier in this article and delivered here in the pictures. If these can grow this fast to this size, imagine what can happen inside the body with the right available blood supply and immunosuppressed system.
SUMMARY
Despite the inability to create perfect causal attribution across time, ages, “vaccination” delivery to arms, and type of cause (actual, proximate, root, contributory, intervening, superseding, concurrent et al), the evidence herein depicted is compelling to a high standard of plausibility and probability.
Knowing the increase in short term circulatory system involved deaths in 2021, the year of the “vaccine”, and knowing the increase in acute renal failure involved deaths in 2021, and now knowing the increase in cancer involved deaths in late 2021, why have not our governments investigated these public health emergencies? Worse than that, why have they purposely and knowingly avoided any research into these easily found statistics? The administration of these C19 “vaccines” has become absurdly criminal as pharmaceutical corporations and government agents know these issues exist, look away from them, cover them up by listing other causes such as C19 itself, and act recklessly with the lives of The People.
END
Additional graphs and commentary to peruse. Perhaps someone else can find use for these.
Examples of the greater offending causes
Tables and Graphs are highlighted and without comments for the readers’ perusal. As you dissect them, please keep in mind that “signals” are sometimes more difficult to find in lower frequencies. In this case, look to higher frequencies for discovery, then attribute to lower frequencies as evidence presents itself. In other words, it is difficult to find younger people who died from the C19 “vaccine” because there are relatively few, though there may be, and likely is, relatively far more frequent death from the C19 “vaccine” in youngers than from covid itself. Once signals are found in the older age groups, they can sometimes be confidently attributed to the younger ages.
There are, however, differences in presentation between, for example, age 20 and age 70. Though the root cause of death may be the C19 “vaccine”, a 20yo may present with myocarditis, thrombocytopenia, or MIS-C from a circulatory system dysregulation issue brought on by the C19 “vaccine”; whereas, an elderly person may present with a simple DVT to PE and dies from the same type of dysregulation from “vaccine”. The latter would not likely be attributed to the same root cause by a researcher unless the cause of dysregulation itself were discovered.
ICD-10 codes graphs and tables shown below:
C798 “Secondary malignant neoplasm of other specified sites”
C780 “Secondary malignant neoplasm of lung”
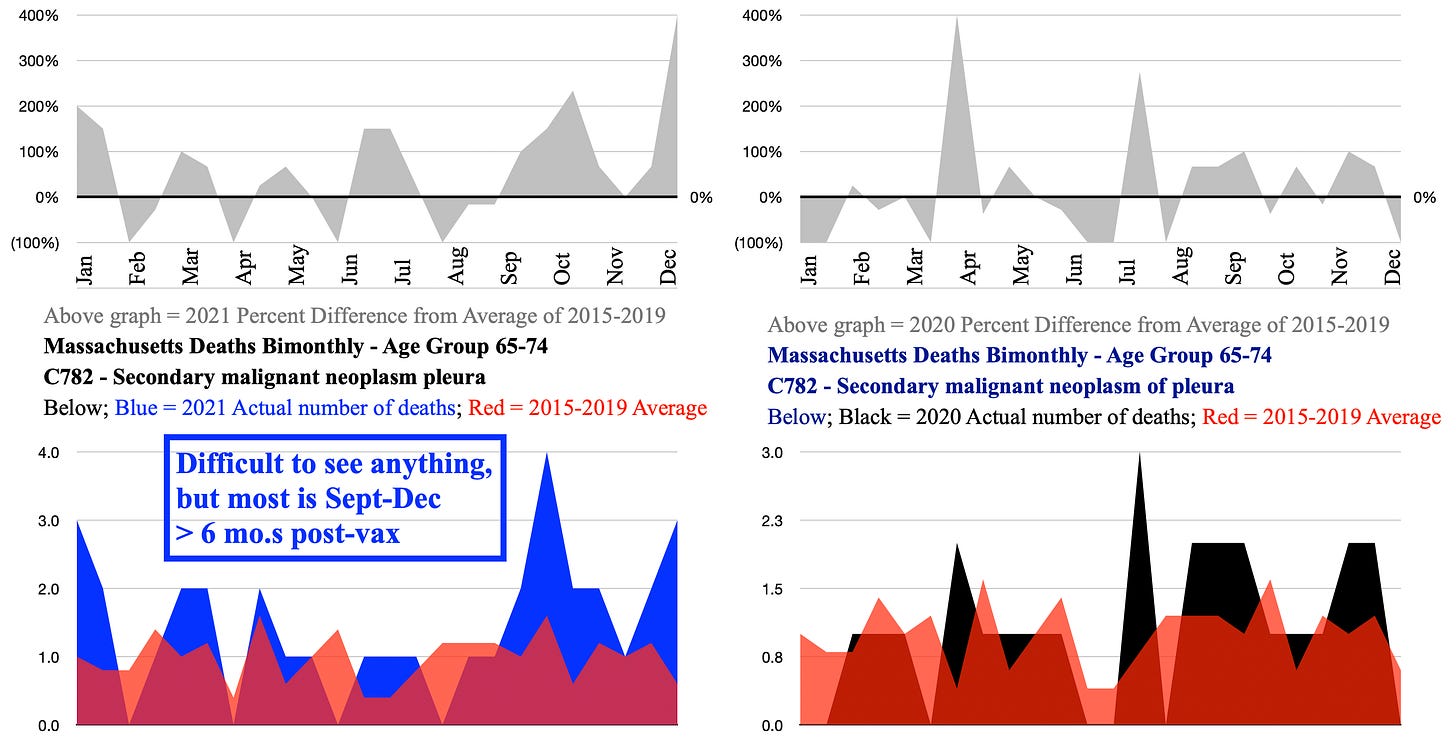
C782 “Secondary malignant neoplasm of pleura”
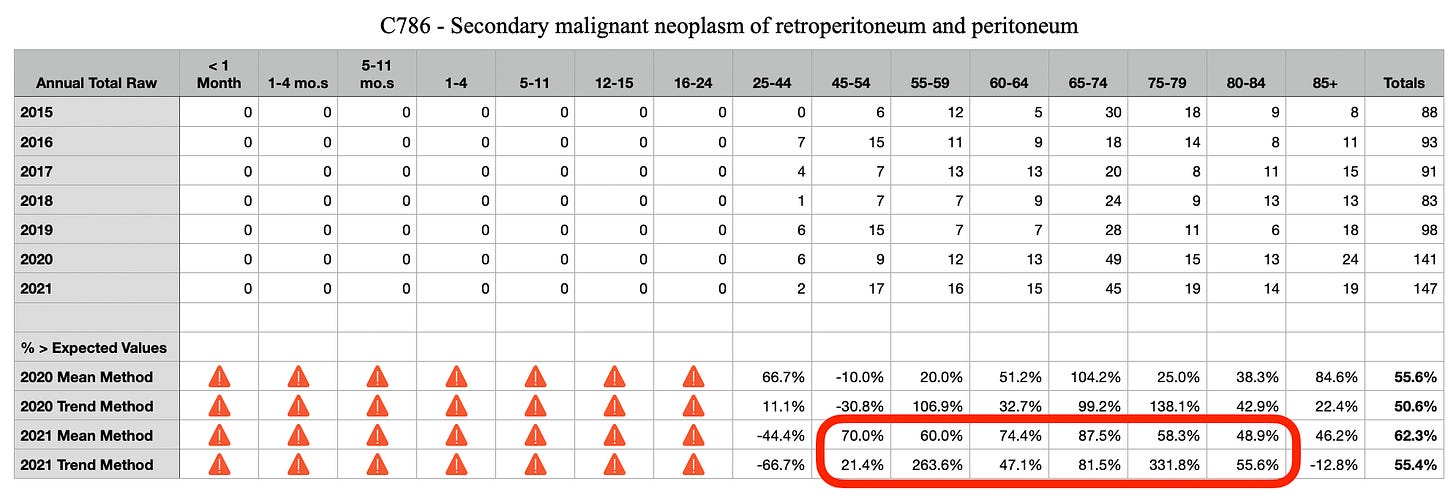
C786 “Secondary malignant neoplasm of retroperitoneum and peritoneum”
C798 Secondary malignant neoplasm of other specified sites
C780 Secondary malignant neoplasm of lung
C782 Secondary malignant neoplasm of pleura
C786 Secondary malignant neoplasm of retroperitoneum and peritoneum
NOTE CHANGE IN AGE GROUP
The C786 ages 65-74yo group NOT SHOWN is anomalously greater in 2020 than 2021. The 55-64yo age group is shown below in its stead. The graphs simply show a much greater occurrence of C786 in 2021 than the 2015-2019 average. The 2020 data shows increased numbers also. Remember that 2020 had an excess 16.2% total deaths. The table of C786 above shows a 50.6% to 55.6% increase in 2020 over 2015-2019 AVERAGE and TREND. The increase in total deaths does not account for such a large increase in this category. Another mystery remains unsolved.










This is extraordinary work. But instead of Paypal, why not just add a paid subscription tier to your subscription options. Even El Gato did that eventually. It is the easiest way for us to support you, and takes us literally one second to do so. I know I would sign up in a heartbeat. And Thanks for what you are doing.
I had an interesting chat with a mate who is a high-powered financial wizard and at the same time a Boosted CovIDIOT....
He was good enough to look at a number of graphs for countries that show a close correlation between boosters and deaths.
His response was correlation does not prove cause.
Yes of course -- but the thing is ... this is happening across a wide range of highly boosted countries - and in low vax countries there are no excess deaths. So it does look very suspicious...
I referenced Ed Dowd who's done some stellar work and compares the excess deaths in the US to the Vietnam War... more excess deaths during the boosters than the entire death count for the US in that war!
I referenced the Indiana insurer reporting a 40% increase in life claims.
These are BIG numbers -- and the finger is pointing at the vaccines -- so surely this should be under investigation - throw in the VAERS numbers and these vaccines should be immediately halted pending review.
Instead they are injecting babies now....
No response to that.
So what might be causing the deaths if it's not the vaccines ... a war ... or a massive natural disaster?
Covid.
I hesitate... maybe that was a slip of the tongue... wait... hold ... wait... nope - not deleting the DM.
Covid? But the vaccines stop people from dying and these are all high vax high boost countries with death totals in excess of what they were before the vax rollout. If it's Covid then the vaccinating should be urgently halted because they are total failure - they don't stop the spread of covid and they don't stop people from dying... what is it they do - other than maim lots of people.
Silence.