N179
A cause worth studying
UPDATE: 21 May 2022
A significant number of records in the 2022 data either have no causes of death yet listed or have only “R99” listed. “R99” is a “pending” or holding place until results become available and the record is amended.
In the 2022 data on-hand, the counts are as follows:
Total number of records Jan 1 - Mar 15: 14,883
Total blank ICD-10 code records Jan 1 - Mar 15: 1,893
Total “R99”-only records Jan 1 - Mar 15: 880
Total blank and “R99”-only records in time period: 2,773
Derived from these numbers, the 2022 numbers in the tables and graphs below are under-represented by up to 22.9%, making thrombocytopenia and acute renal failure far worse in 2022 than is already depicted below. As a sanity check, in 2019, there are nil blank ICD-10 code records and there are ten “R99"-only records in the time period. N179 remains a public health emergency and the government in that state continues to fail in its duty of care to the public.
C19 “vaccines” - the cause of causes and Scienter, not science are long articles showing significant evidence that covid immunization correlates to increased likelihood of death. This article is the first in a series of shorter, more in-depth articles about individual causes. Please read, copy, and meme parts to social media.
The initial objective was to depict thrombocytopenia (“D696”) as a cause of death and how it relates in frequency to the roll-out of the covid “vaccine” and covid itself. Inspection of D696-involved death certificates from Massachusetts yielded many coincident causes as one would expect. However, one not studied in C19 “vaccines” - the cause of causes stood out. And when cursory analysis of the new stand-out proved significant, the cause was brought to dominate this article.
Acute renal failure (“N179”) accompanies many deaths. “Acute” means very recent, fast, sharp, intense, and brief as opposed to “chronic”, which means continuing for a long time, having a history of frequent issues, and a disease of long duration.
Blood flow to the kidneys is imperative for function, like any other organ. Looking solely at circulatory issues ignores downstream consequences that affect the liver, spleen, kidneys, brain, lungs, and other systems in the body. Though this article focuses on N179, don’t think that the circulatory system is not the next higher cause in the hierarchy. In other words, circulatory issues may cause N179.
Before diving into N179, data from D696 is depicted as it also has value in understanding the changes in 2021 versus 2020 and the prior five years.
Thrombocytopenia - The Undercard
The Mayo Clinic’s definition can be found HERE and is condensed below:
“Thrombocytopenia … a low blood platelet count. Platelets (thrombocytes) … stop bleeding by clumping and forming plugs in blood vessel injuries.
Thrombocytopenia might occur as a result of … leukemia or an immune system problem. Or … a side effect of taking certain medications.
… In rare cases, the number of platelets can be so low that dangerous internal bleeding occurs…”
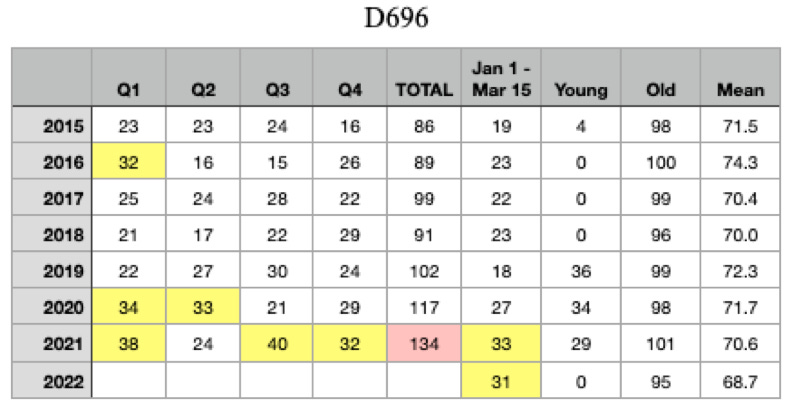
Below is a table of D696-involved deaths from the Massachusetts death certificate database.
D696 often occurs as a result of medication such as Warfarin (Coumadin), Heparin, or other anticoagulants indicated for patients susceptible to dangerous clots. D696 also occurs as a result of dysregulation of platelets created in the bone marrow by megakaryocites.
D696 is often caused by leukemia. And now, it seems there is something else causing greater numbers of incidents of D696-involved deaths in 2021.
From the table above, in the covid year of 2020, D696 was 12% to 25% greater than expected value by trend or mean methods, respectively. Remember that 2020 was the year of covid’s large initial wave, mid-March thru mid-June 2020, and a much smaller wave beginning in the fall of 2020.
In the covid “vaccine” year of 2021, D696 was 24% to 43% greater than expected value by trend or mean methods, respectively, almost double that of 2020.
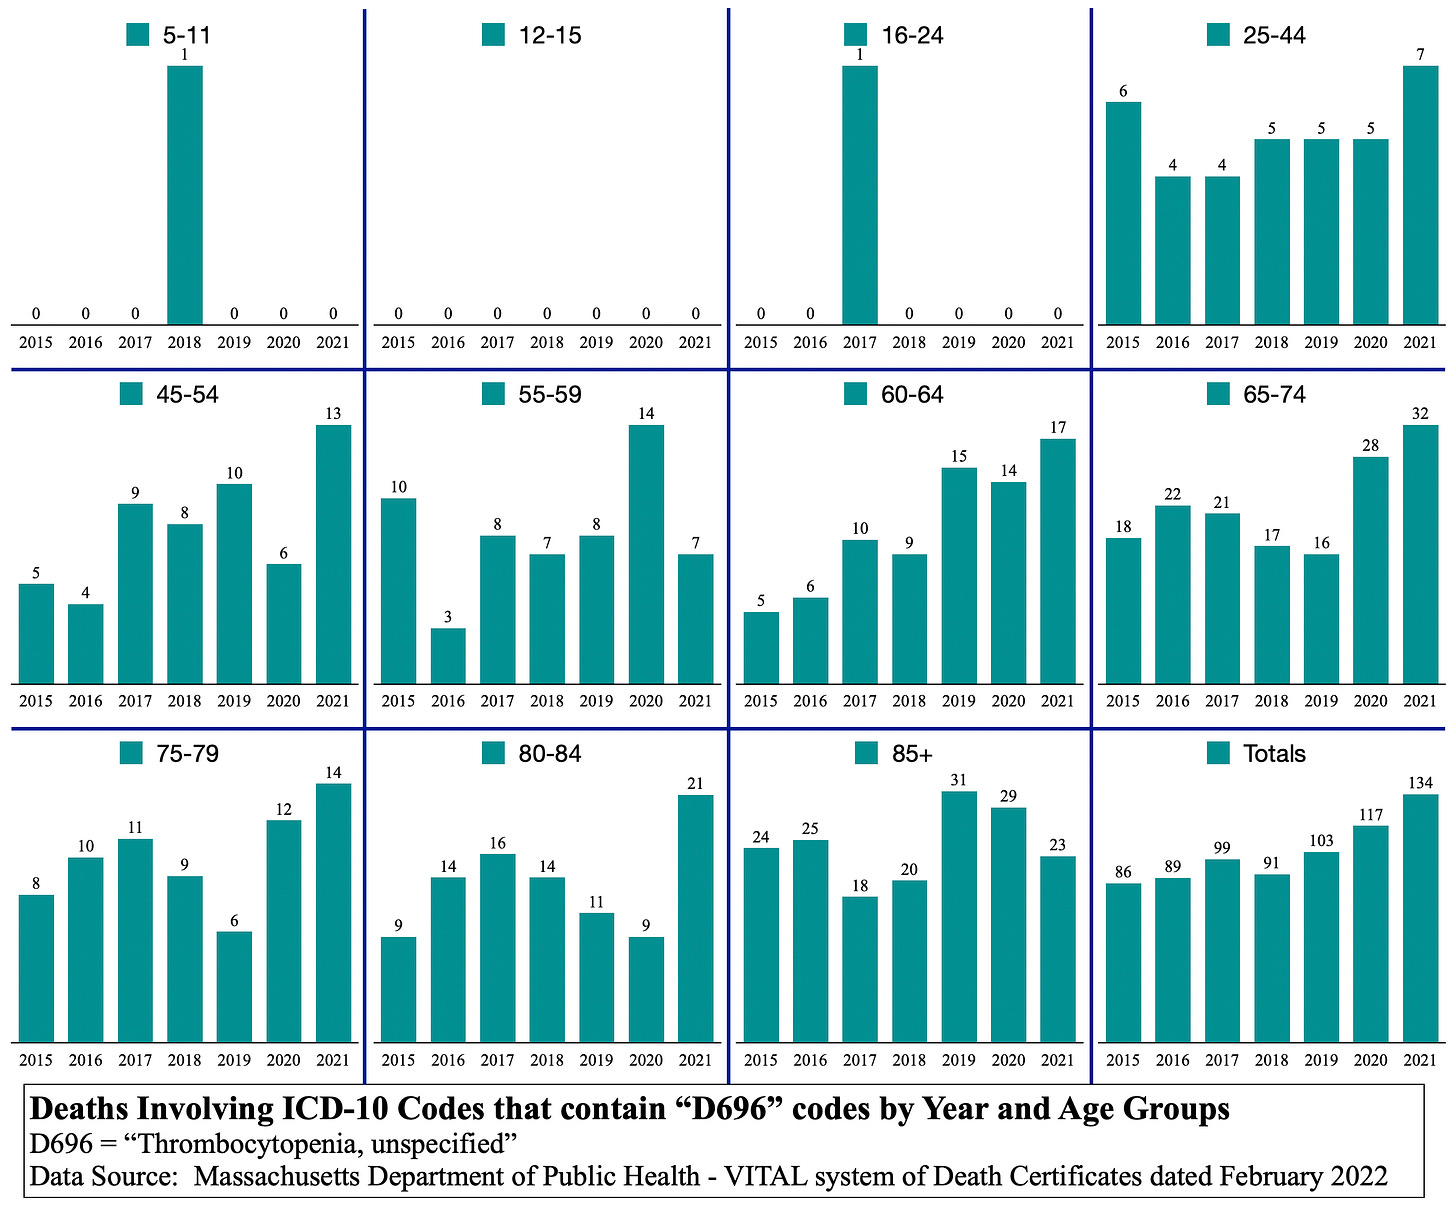
The pink highlights show that 2021 was the highest among all the years in six age groups and in the “Total”, while 2020 topped the 55-59yo age group and 2019 topped the 85+yo age group. Notice that the age groups are not each equal in number of years. 17 deaths in the 5-total-yr group of 60-64 is as significant as the 32 deaths in the 10-total-yr age group of 65-74.
2021 looks disastrous when considering excess above normal.
The yellow highlights are values that exceed 25%. These represent how much greater than expected values the actual values are. The highlighted cells are not modest amounts. Many of these are between 50% and 110% of expected values. In quantity of deaths, these equate to 13 to 23 extra deaths in 2020 using trend and mean methods, respectively, and 26 to 40 extra deaths in 2021 using trend and mean methods, respectively.
Below is a table depicting D696-involved deaths by quarter and it includes an awkward time period of January 1 through March 15 of each year because that is the available period of 2022 data to the time of this article. In order to compare apples to apples, the period was also used in the other years. (The extra day in this period in 2016 and 2020 is not considered.)
D696 can happen in any age. Prevalence by age cannot be extracted from this table (see below for age group strata).
Yellow depicts any time period with a number greater than 30. While one anomaly is seen in 2016, it is clear that covid in 2020 correlates to increased D696 and the year of injection 2021 far surpasses the year of covid 2020, not just in one quarter, but in three quarters plus the awkward time period in 2022, and in “Total”.
Below are graphs of D696-involved deaths by age group and year.
The numbers in ages under 45yo are low enough to ignore.
45-54yo begins the significant difference depiction shown in 2021. The yellow highlights from the tables are depicted in every 2021 column except 55-59yo and 85+yo.
It should not be forgotten that the culling of many elderly people in 2Q2020 still affects numbers in 2021 and 2022. People cannot die twice. They’re gone and not susceptible. There should be a deficit after 2020. This is what makes the 2021 somewhat steady stream of excess deaths unlike a seasonal virus and more like a roll-out of some externality (that people stand in line to receive en masse).
The graph below adds COVID-19 (“U071”) and depicts those whose deaths were listed as involving BOTH D696 AND U071.
Though the numbers are low, there’s still a significant signal that can be seen.
NOTE: Regarding the word “signal”, the disciplines of epidemiology, virology, biology et al are not as expert in extracting signals from data as certain types of systems engineers. Electrical engineers (or others studied in frequency domain analysis) with experience in digital signal processing are likely the best to address these discrete systems of human individuals. Nyquist rate is the topic of a future article, if time allows.
As you read the following notes, refer back to the tables for understanding:
2020 started out covid-naive
MA mid-March thru mid-June 2020 was the first very large seasonal wave of covid (Q2, qty 9)
MA mid-fall (Q4, qty 5) was the second wave, much smaller, of seasonal covid
2020 Quarterly set {0,9,0,5} perfectly aligns with the seasonal first and second waves of covid in both timing and amplitude
2021 began far from covid-naive
Some people estimate that 60% to 90% were covid recovered and had natural and/or innate immunity at the start of the year
Most older people were immunized in Q1 with two doses
Middle-ages mostly received dose 1 in Q1, dose 2 in Q2
Some university and younger students waited until Q3 summer or before school for dose 1, pushing dose 2 into Q4
Many elderly received dose 3 boosters in Q3 and Q4
2021 Quarterly set {11,2,6,8} does not match covid seasonality as much, but does match immunization injection schedule across the Massachusetts population
Other NOTES:
an extra 1,000 “PENDING” outcomes in 2021 in R99 codes have yet to be assigned causes. Imagine what is hiding in those THOUSAND extra deaths.
Massachusetts is 4th in the USA in % of population receiving dose 2.
QUESTIONS:
Why are the D696 AND U071 deaths DOUBLE in 2021 compared to 2020?
Why are there as many D696 AND U071 deaths in Q3&4 of 2021 alone as there were in all of 2020 considering 90% of the older age groups were immunized by 3Q2021 AND covid had culled the susceptible in 2020?
Why does the death look seasonal and diminishing as it should in 2020, but unseasonal and steady in 2021 AND into 2022?
These are questions that a state Department of Public Health would investigate, if they were working for The People.
How N179 came to the fore
N179 was seen in individual records and then analyzed as a combination of both D696 and N179. Below is the table that resulted from curiosity.
Numbers are, again, low and susceptible to singular events obfuscating signals, but are worth inspecting nonetheless. 2017 was a bad year for D696 in combination with N179, but still could not catch 2021 and 2022’s trajectory. The booster quarter of 3Q2021 correlates with this combination and Jan 1 thru Mar 15 of 2022 exceeds 2016, 2020, and 2021 by a significant amount.
This quick, curious look provided impetus to investigate N179 on its own in-depth.
Acute renal failure - The Main Event
The tables and graphs below show such a stark issue in N179 deaths that they are first posted without explanation for readers to take in on your own. The first set is for 2015 thru 2021 and the second set is only for that awkward time period from January 1 to March 15 of each year and includes 2022 showing that the issue continues.
Massachusetts citizens should demand investigation. Americans and nations of the world, take notice.
Nothing is highlighted in yellow or pink because almost the entire table would be highlighted. This is a health disaster.
Correlation, causation, or any other buzzword common in today’s COVID-19-dominated world is not needed when looking at these numbers. N179 stands on its own as something the Massachusetts Department of Public Health should analyze as soon as possible as a PUBLIC EMERGENCY. Discover the cause. This does not just happen and, as depicted, is a far greater issue than the so-called pandemic in 2020 because this is likely caused by man-made treatment of some type whereas covid is an airborne virus that cannot be controlled.
The CDC, NIH, FDA, MA DPH and every other public health entity should be extremely concerned by these numbers. The citizens of that state should demand answers. The citizens of USA should demand answers. The world should ask what is going on in the state of Moderna’s headquarters and the state of hundreds of bio and pharma technology companies, many in the range of $Billions in annual revenue.
Acute renal failure in the age groups of 45-84yo in 2021 and 2022 is a public health emergency that does not correlate to COVID-19. What is causing it?
In the full year graphs above, 2020, which had double the COVID-19 deaths of 2021, had fewer N179 deaths than 2021, the year of the “vaccine”.
What is causing kidneys to stop functioning in 2021 and 2022 far in excess of 2020?
The wildcard
Remdesivir was indicated beginning middle to end of 2020 depending on age and other factors, and then indicated more over time. Remdisivir has been associated with kidney failure.
Is there anyone honest left in any department of public health who is concerned for public health?
Conclusion
This is so disturbing that a conclusion is anticlimactic.
Something is causing a spike in kidney failure killing excess hundreds of people in Massachusetts involving this cause alone, not to diminish or forget others.
There are three main events occurring in 2020, 2021, and 2022: COVID-19 disease, Remdesivir treatment, and covid “vaccine” immunization. COVID-19 does not fit the timing of N179-involved deaths. Remdesivir and the “vaccine” do fit the timing of N179-involved deaths.
If the immunization dates and types were available on the death certificates, then the “vaccine” could be ruled out or be kept on the list of possible causes of death. Transparency would solve this issue.
BONUS - Timeline of deaths involving N179
From the above graph, black line 2020, the year of covid, can be clearly seen in the first wave and then settles to normal red years.
The blue line “vaccine” year of 2021 varies from about 40% to 100%, but remains elevated consistently, in excess of what is expected in the red years of 2015-2019.
This is a real public health emergency. Government is failing in its duty to find, recognize, and mitigate whatever is the cause of all these deaths.
Above is the same graph in 3-D. How much blue needs to be seen to realize there is an issue? Acute renal failure is a public health emergency.
BONUS 2 - Commentary on relative average ages
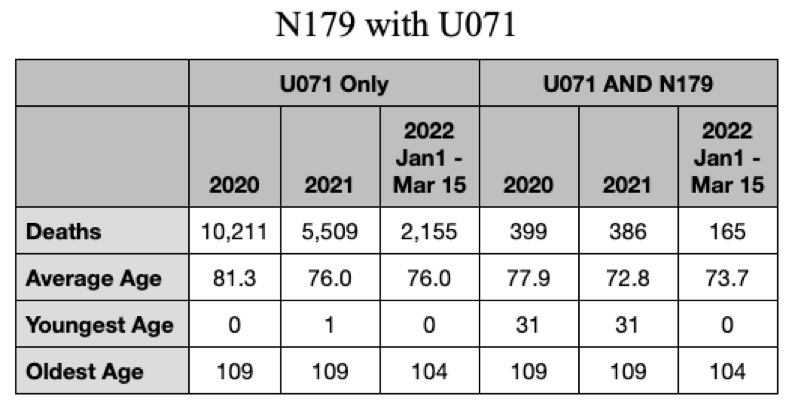
Despite a few updates in database at a later time, the numbers in this late entry are roughly the same. The important notable is the average age of N179 in the year 2021. An average difference of 1.5 years is significant as it makes the life-years-lost 50% more than number of decedents. In other words, 1,000 excess deaths at an average age 1.5 years lower than normal is really 1,500 life-years lost.
Bottom line = the situation is far worse than the excess deaths noted in all the other graphs. These are younger people losing more life-years.
BONUS 3 - IMPORTANT
Covid cannot be blamed for the increase in N179 as the above table demonstrates. There are double the covid deaths in 2020 as compared to 2021, but there are roughly the same number of U071 and N179 deaths in 2020 as in 2021.
The average age of covid death dropped from 81.3 in 2020 to 76.0 in 2021. The life-years lost are, thus, 5X greater in 2021 for whatever is killing people. You may be leave it is covid, or you may believe what the data shows, which is that Massachusetts medical examiners fraudulently entered causes of death.
There are Massachusetts examples of fraud in which people severely reacted from the “vaccine” within minutes to hours, died within hours to days after “vaccination”, and were listed as covid deaths in death certificates. These were young people; some were children.
This final graph tells the story of something killing people that is not covid and is taking younger people than covid takes. What is causing this?
Peril lies in vials.


Disclaimer of Liability ™
Whilst we endeavor to make our products toxic (1,291 side effects), we make no representations or warranties of any kind, express or implied about their efficacy and safety.
We cannot guarantee that your gene 144 won’t be deleted, your X / Y Chromosome won’t be inverted, your gene 69-70 won’t be deleted or mutated, that you may experience loss-of-function due to protein folding, that your gene E1, E3, E4 won’t be deleted, that you won’t receive shots full of magnetic graphene oxides, nano-biosensors and self-integrated bio-circuits (motherboards, transistors, routers, antennas, etc…).
We do not guarantee that you won’t be MAC Addressed as per Clown Schwab’s instructions (COVID -19 is a rare but narrow window of opportunity to rethink, reinvent, reset our world), that your Cancer Fighting CD8 T Cells won’t be suppressed.
By using our products you agree that you automatically become legally a trans-human and therefore our property since you are GM-modified using our patented mRNAs (CERTIORARI 12–398).
Trans-humans do not enjoy any human or other rights of a state and this applies worldwide. Our patents are under US jurisdiction and law, where they were registered.
Any reliance you place on our products is therefore strictly at your own risk.
We care,
CEOs Murderna & Schizer.
...
Dr. Red Pill Fact Checker: They make sh$t!
Schizer (1minute video)
https://librti.com/page/view-video?id=1438
Murderna (1minute video)
https://librti.com/page/view-video?id=1515
Micro-Tech in COMIRNATY Quackcine – New Zealand D SOS
https://nzdsos.com/wp-content/uploads/2022/04/Presentation-Microtech.pdf
How to Detect your MAC Address (e.g: “Pfizer borg 00:00:5e:00:53:af”)
https://forbiddenknowledgetv.net/are-you-or-someone-around-you-chipped-how-to-find-out/
Micro-Tech Patents (50) – Charles Lieber – Caught!
https://drtrozzi.org/2021/12/30/nanotech-expert-charles-lieber-first-high-level-covid-criminal-convicted/
Covid-19 Quackcines Worldwide Democide - 1,291 Side Effects – Schizer Approval Document Reveals
https://childrenshealthdefense.org/wp-content/uploads/pfizer-doc-5.3.6-postmarketing-experience.pdf#page=30
Suppression of Cancer Fighting CD8 T Cells - 100% of People Tested pre and post Covid-injections.
https://drtrozzi.org/2022/04/06/global-cancer-rates-exploding-post-vaccines-being-covered-up/
Safe and Effective: 16 German and Austrian Mayors Under 60 Are 'Suddenly and Unexpectedly' Dropping Dead.
https://rairfoundation.com/epidemic-german-and-austrian-mayors-under-60-aresuddenly-and-unexpectedly-dropping-dead/
Schizer Massive Data Fraud: Time to Lock Them Up!
https://drtrozzi.org/2022/04/29/time-to-lock-them-up/
How Bad is my Batch?
https://howbadismybatch.com/
The Covid Lies of the Century
https://doctors4covidethics.org/wp-content/uploads/2022/04/The-Covid-Lies-updated.pdf
Murderna Quackcine Patented 9 Months Before Plandemic on 2019-03-28
https://www.veteranstoday.com/2022/04/11/moderna-vaccine-patented-9-months-before-pandemic-thanks-to-the-fauci-baric-manmade-sars-viruses/
Covid-19 Plandemic Blueprint – RKM Lockstep 2010 Report.
https://themillenniumreport.com/2020/07/rockefeller-lockstep-2010-was-blueprint-for-2020-covid-19-pandemic/
Event 201, a High-level Pandemic Exercise on October 18, 2019, in New York
https://www.centerforhealthsecurity.org/event201/
50 Efficacy Studies that Rebuke Vaccine Mandates
https://brownstone.org/articles/16-studies-on-vaccine-efficacy/
Rundeathisnear. Absolutely. No question. How can we get this more visible? This is
murder by hospital./FDA/CDC/NIH.