Hey Florida - The Real CdC is pivoting south
Soon to be released is a methodology statement sent to Dr. Joseph Ladapo
Dr. Joseph Ladapo and John Beaudoin, Sr. (me) met at a conference in the Boston area on October 19, 2024. Ladapo said he was not convinced about Beaudoin’s (my) methodology and requested a methodology statement.
In preparing the methodology statement, Beaudoin created some graphs specific to Florida. Some were posted on X (the social media platform formerly known as Prince … uh … I mean Twitter). Others are here posted.
The point I have been trying to make for a long time is that data and statistics will never lead to conclusive evidence in a court of jury or judge or public opinion. Graphs and statistics can only quantify, but cannot determine causality. There are too many confounding and manipulated variables. Record-level and case-level forensic investigation must occur for causality to be determined.
There are TWO major signals of kidney failure in the graphs above. One is seasonal and aligns with the waves of Covid. The other ramps on a linearly increasing trend from November 2020 to about Febuary 2022, when it then becomes a steady-state excess.
In order to achieve steady-state excess, the cause of the externality must continue to be operational, else the line plot would return to the normal bands.
Does the increase in N17 AKI coincide with an increase in COVID-19 vaccinations? Once the vaccinations flattened out, did kidney failure flatten out? The answer to both is “yes.” However, this is only shows which records to look at. Start with younger people who were healthy and then died quickly involving kidney failure.
To remind you of the shear numbers of excess deaths involving sudden kidney failure, here are some graphs posted on X.
To determine if the excess All-Cause deaths caused N17 to also be artificially high or if it really is closely related to Covid, divide these numbers above by All-Cause total deaths and you will see the difference. 2020 excess nearly disappears in the graph below.
Graphs are not the answer to causality, but they are “reasonable suspicion and belief that The People are in imminent danger of harm.” State officials in Florida have a legal duty to investigate these fifteen thosuand excess deaths. Omission of investigation is a criminal negative act.
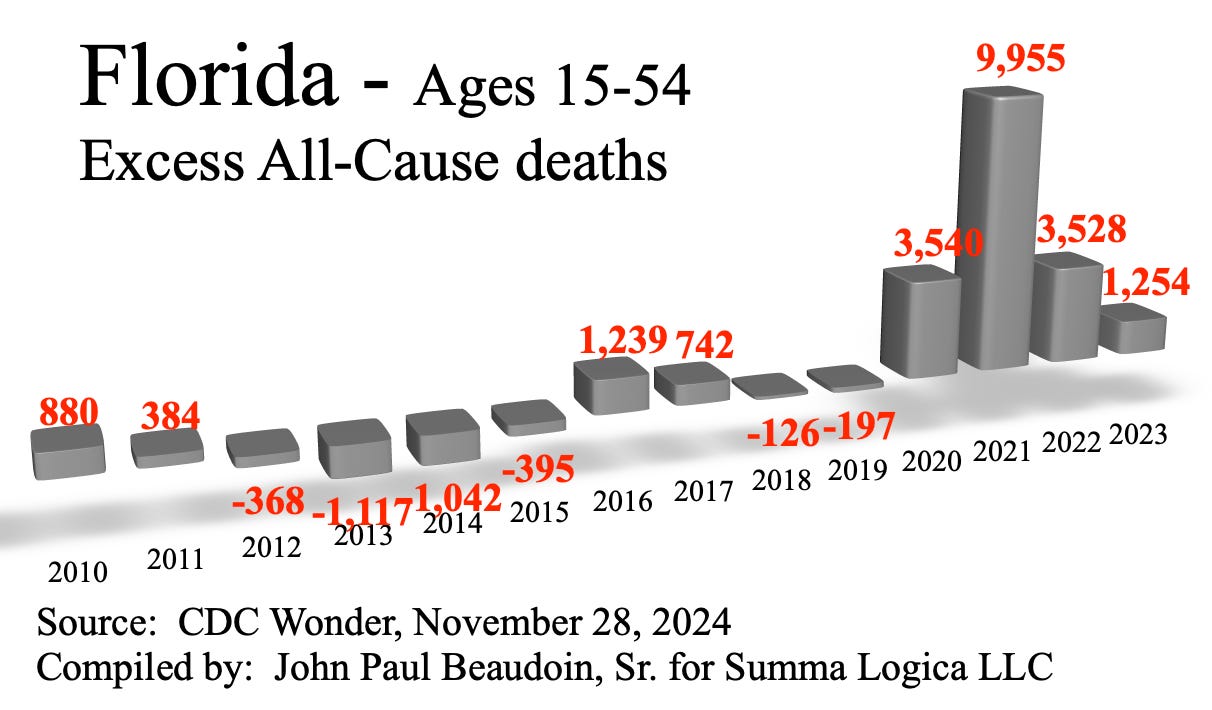
And it was not just old people taken by N17 AKI like it was for Covid-19. Here are the numbers for ages 15 to 54.
That’s a lot of excess deaths for children and parents of young children. This is a mass casualty even like nothing else in 100 years except World War II.
There were many certified Covid deaths in 2020. Yet look at the graph above. Are we to believe that ages 15-54 were skipped over by the first wave in 2020, but then all of a sudden in 2021 when NIH drug protocols were incentivized by the CMS NCTAP program and when the Covid vaccines rolled out, they started dying from a different condition (N17) than older people did in early 2020? No. That’s ridiculous. The state must investigate, else be criminally liable for their inaction as to the deaths of tens of thosuands of excess deaths.
More graphs depicting All-Cause deaths in the age groups are below.
All-Cause excess depiction in age group 15-54.
Reminders
Trial data is 4.5 years old. The source of the data are the criminals who will not just give you the smoking gun for their crime. Millions of man-hours were diverted to trial data. Why?
Since 2021, we now have billions of doses given in the Unites States. The government has the medical files, vaccine information files, death records, insurance records.
While the public is chasing shiny objects like trial data or research papers, the government is laughing at all of us as they keep hidden all the records that can solve the vaccine debate in one man-week of forensic investigation.
It’s really that simple. The government has 1,000 times the records and data as are in the Moderna and Pfizer trial data. The only thing the trial data is good for is later criminal prosecution. I’m not saying it’s not valuable in that regard. But if your intent is to prove the vaccines killed a lot of people, then you’re wasting your time and energy on trials and research papers.
Perhaps you’ve been led to ineffective plans that yield very little. I’m sorry to have to say this. Four years of doing the same thing over and over again reading research papers and looking through trial data has yielded very little as hundreds of thousands of people die EACH YEAR from Covid vaccines.
We need to be more strategic. Please look for Top-Down Investigation, Bottom-Up Quantification (TInBUQ) Methodology coming out soon. Demand data transparency from your government. They deny us. Sue them. Demand it. It’s OUR data, not theirs. People are led to the next shiny object research paper every day. “Did you see the new paper on autopsies?” “Did you see that 17 million people died worldwide from the vaccine?” “Did you see the meta-analysis peer reviewed randomized controlled trial double blind placebo controlled … [whatever]?”


Kidney failure sounds an awful lot like Remdesivir related deaths (I’m sure the jabs played a role as well, it’s what spurned Dr. Humphries to write Rising From the Dead after seeing the injuries following Flu shots ). Did you get a database together for FL?
Hey, John, didn't you know that people drank very heavily, very heavily, during the lockdowns? Hence, the excess renal deaths. But, so the "experts" say, correlation does not equal causation. Of course, they cannot rationalize the excess cardiac problems, the blood clotting, and so many other out of control medical problems. How do they explain the explosion of (turbo) cancer in those younger than 50? Nothing is admitted, unless the blame can be shifted. You, sir, are a one man demolition team. Keep up the great work.