
Differences in Pneumonia with and without COVID by Age Group
A Case for the Negative Efficacy of COVID Vaccines

[Fifth article in a series. 1) Leadership, Management, and Strategic Planning in the Covid Era, 2) The Ineffective Messaging of “Myocarditis in Young, Male Athletes”, 3) Sudden Kidney Failure Began with Government Incentives, not with COVID, 4) Top-Down Investigation, Bottom-Up Quantification Method for Epidemiological Vigilance, 5) Differences in Pneumonia, COVID, and All-Cause Death Profiles by Age Group. title changed.]
This fifth article in the series does not fit in well with the others. However, I’m obligated now. So I’ll gitter dun because I have an important new story line I want to dive into as an investigative journalist. I tried waking everyone up with conclusive evidence from official records elucidated in two books, multiple memoranda sent to state officials and the fed agencies, lawsuits, and even a public health methodology better than any state or federal agency has produced.
Hubris blinds the PhDs and MDs from recognizing pragmatism and efficient solutions rather than bantering for years over the programmed folly of journal-published, peer-reviewed, RCT’d, double blinded, placebo controlled … corrupted, confounded, under-powered, biased, bought and paid for, government-funded, hyperbolically-inferenced, and just plain boring research papers.
After this article, I will turn my attention to something I can sink my mind and discernment into. Perhaps through evaluation of this one case I came across yesterday, I can explain to people how we got here as a society with a loss of access to the third branch of our government.
Let’s get this respiratory issue printed so I can move on.
Think about negative efficacy when you view and evaluate the rest of this article.
This article comprises graphs and comments. My subjective bias is obviously involved. However, the numbers are the numbers. You can discern, but I will try to lead you because that is what has been asked of me in these articles.
Housekeeping
All data is from the official Vital Records departments of Minnesota, Massachusetts, and Connecticut. The graphs will appear in sets in the order just mentioned.
Two age groups are used: 1) Ages 18 to 54, inclusive, and 2) Ages 75 to 120, inclusive (I use 120 as an upper end. If someone escapes the data bounding, they deserve to — they lived past 120 years old.)
The International Classification of Diseases (ICD) codes are put out by the World Health Organization (WHO), subsets of which are adopted by nations.
ICD code J18 includes unspecified pneumonia. J18 dominates the pneumonia category. Some J15 bacterial pneumonia and J12 viral pneumonia are used because the death certifier did a thorough job. However, the unspecified category dominates pneumonia by a long shot.
U07.1 is COVID-19
The underlying cause of death (UCoD), used by death certifiers and the Centers for Disease Control and Prevention (CDC), is considered the root cause of death—the first cause that initiated a cascade of causes in the causal chain that caused death. The UCoD is not used in these analyses. If a cause of death such as J18 or U07.1 is on a death record, it is counted in all these graphs. If people knew how poorly managed the UCoDs are by the creators of the records, then no researcher would differentiate between UCoD and any other mention on the death record. Some certifiers write the death records backwards. Some just write things in boxes not caring what came first or second or last. Others write minimally. One doctor seemed to write the same thing on everyone’s death record regardless of what they died from.
In order to determine the number of deaths that contained J18 and not U07.1, the number of records with both were determined; and then that number was subtracted from J18 totals.
The graphs use 51-Day rolling averages. The data is daily, but smoothed by averaging.
Here we go:
First, look at Figure 1 J18 Pneumonia in ages 75+.
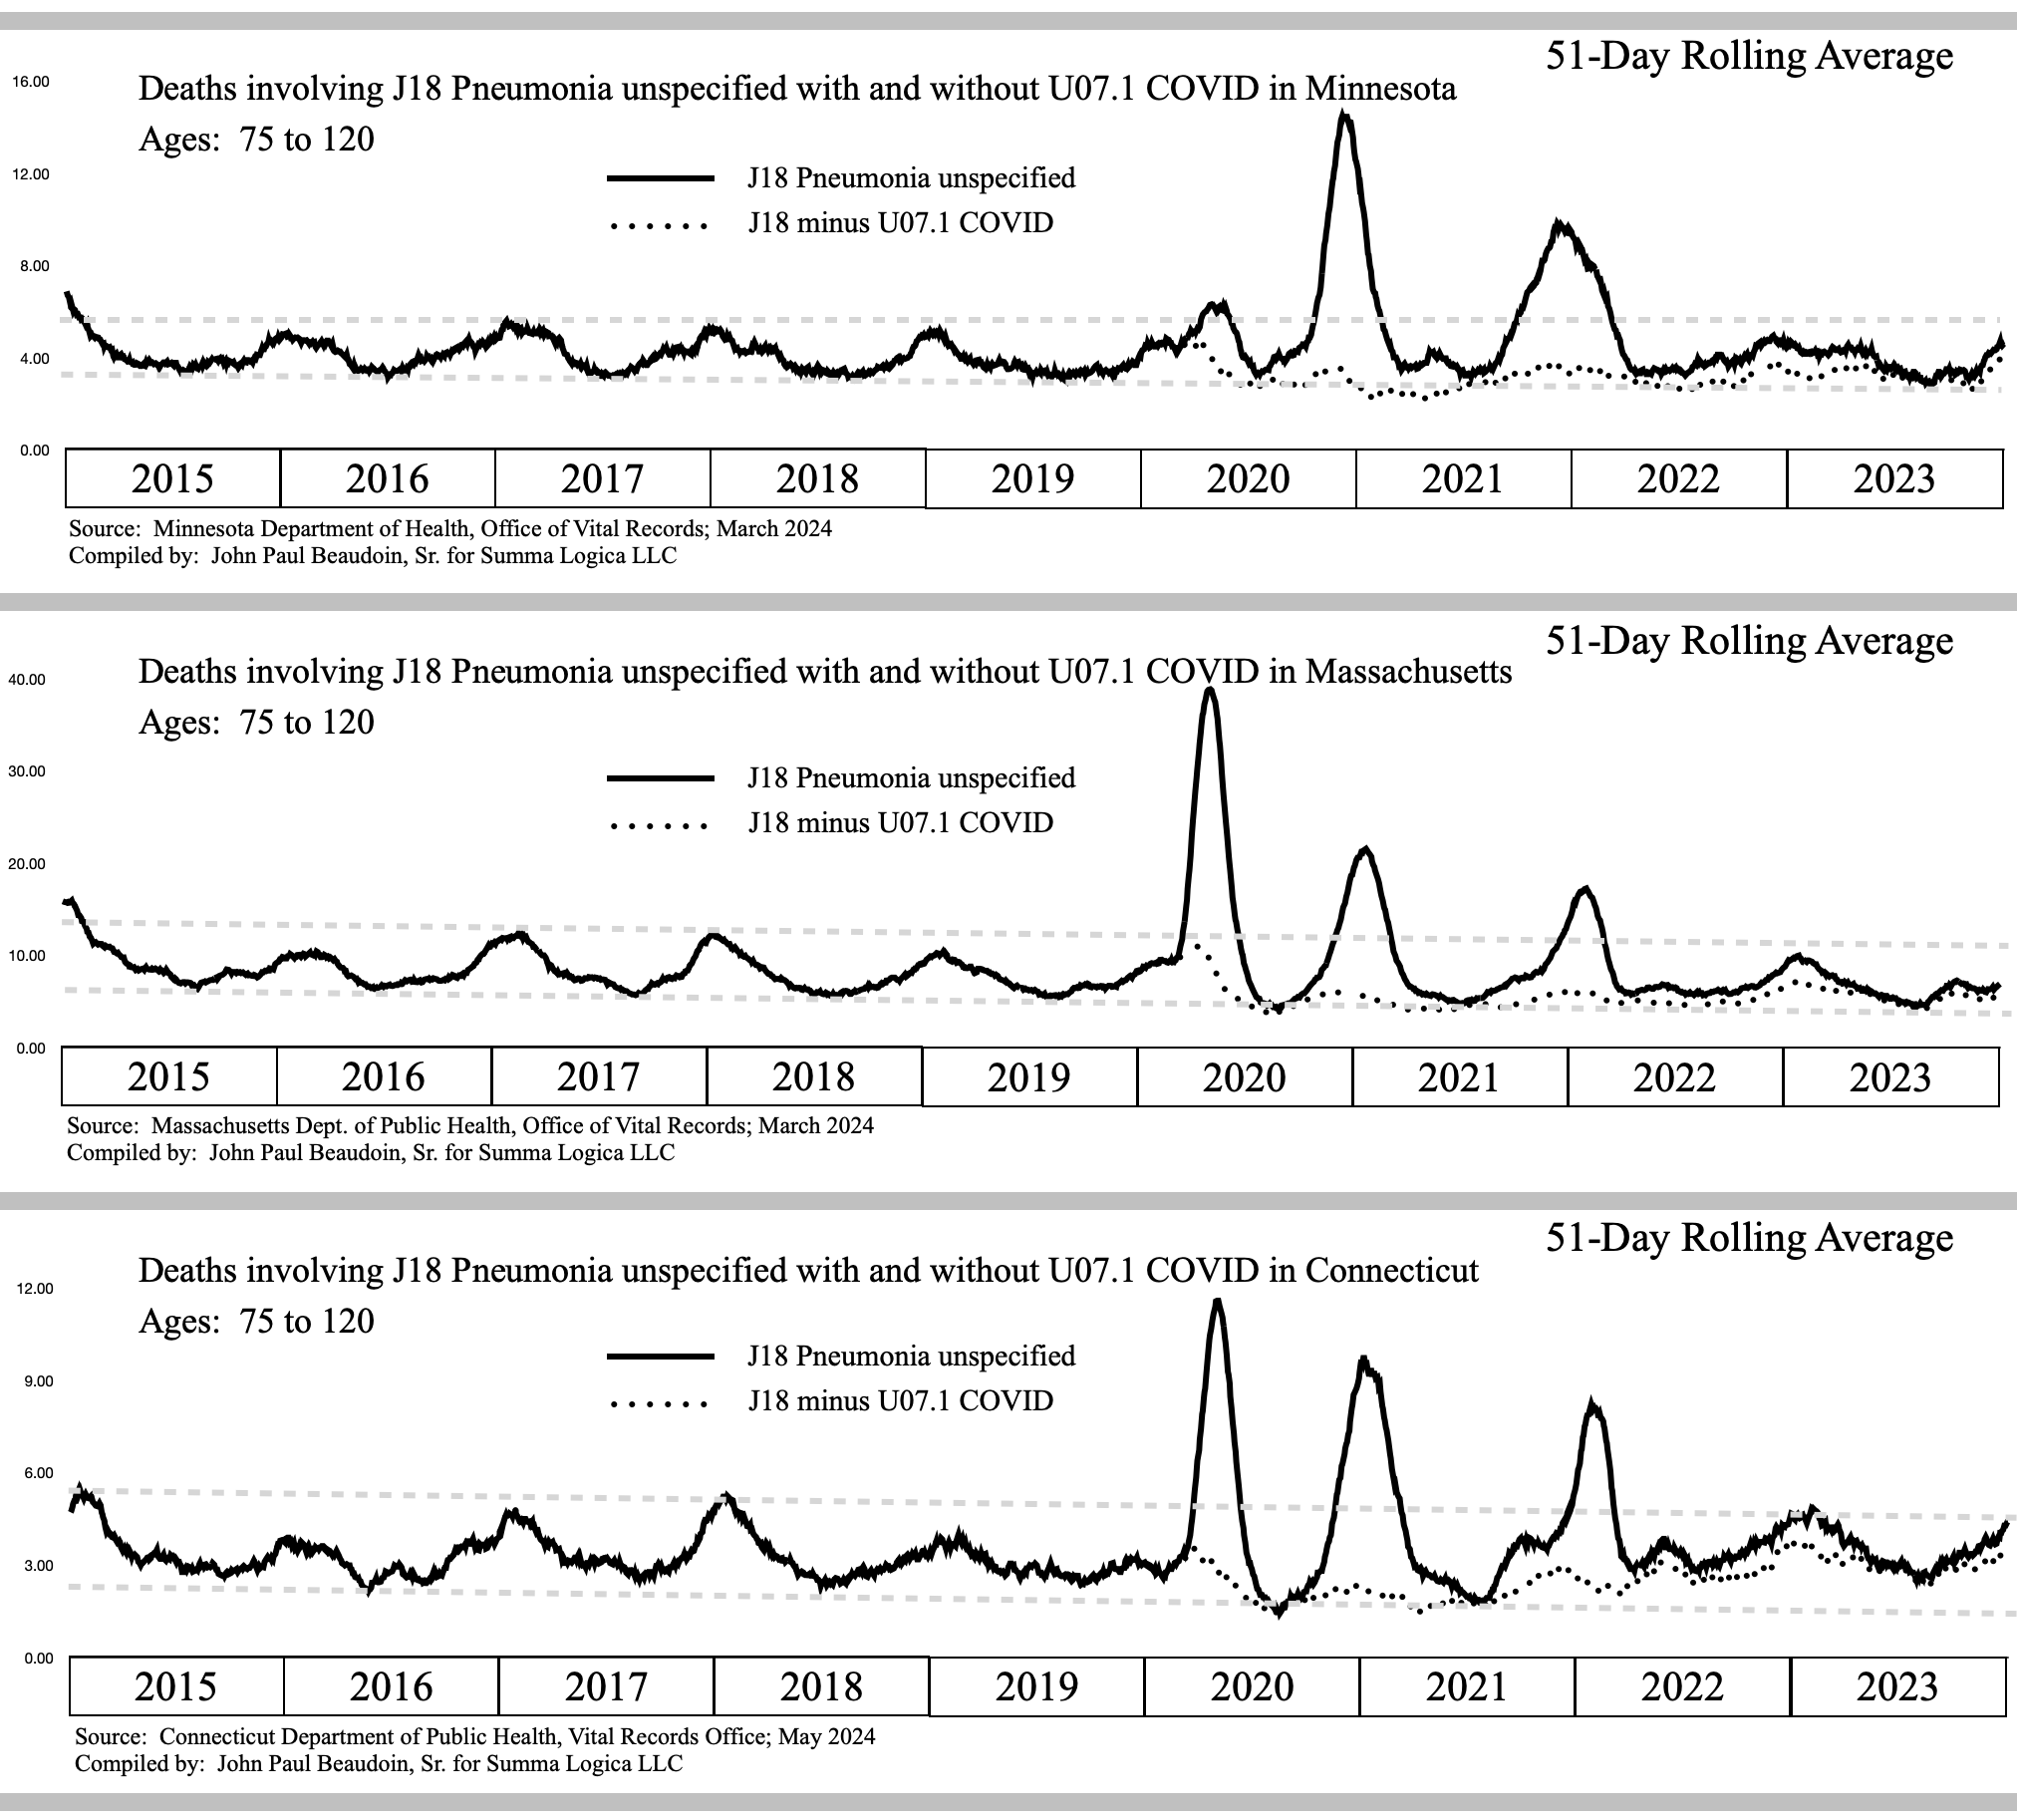
Figure 1
Comments:
In all 3 states, from 2015 through 2019, the winters are the peaks and the summers are the troughs. J18 pneumonia is highly seasonal. More people die in the winter than in the summer.
In spring 2020, a small externality of excess J18 pneumonia involved deaths occurred in Minnesota
In spring 2020, very large externalities of excess J18 pneumonia involved deaths occurred in both Massachusetts and Connecticut
Take a moment to realize how different the states are in this regard. Massachusetts and Connecticut border each other and are compact. Minnesota is ~1,100 miles from Massachusetts.
The summer of 2020, after the externality (call it COVID if you want) entered societies, went back to normal baseline. The baseline is not elevated even after a first COVID wave. Old people 75+ did not die at a higher rate than normal from pneumonia in the summer of 2020.
The winter of 2020/2021 was starkly affected in all 3 states. In Minnesota, it is the largest wave. One can speculate that COVID got to Minnesota too late in the spring of 2020 and turned off due to warm weather. Or one can speculate that Minnesota had not yet gotten the message to use EUA drugs such as remdesivir or paxlovid to kill people via kidney, liver, or other organ failure. There are numerous other theories.
In Minnesota, the summer of 2021 did not return to baseline normal. What happened in the summer of 2021 in Minnesota to cause unseasonable J18 pneumonia deaths in ages 75+? Also, in Connecticut, in August, there is a sharp rise for some reason. And in Massachusetts, the rise in August is noticeably sharper and earlier than prior years. What would cause a sudden rise in pneumonia involved deaths unseasonably especially when more than 90% of this age group was “fully vaccinated” for COVID earlier in the year January through April 2021? It’s as if the COVID “vaccines” have negative efficacy for pneumonia even in the elderly and even after the weakest among them were already killed in the first two waves of COVID.
In all 3 states, the third wave of COVID brought fewer J18 pneumonia deaths than the second wave. This is normal. Diseases generally get less virulent over time. There are more immune people (herd immunity). And after 3 waves, the disease is called endemic and like a seasonal cold. The fourth waves in 2022/2023 are all in the normal range indicating that COVID death outcomes were really completed in March 2022 as shown by excess pneumonia deaths.
Now please look at the dotted lines. Those are deaths involving pneumonia that did not involve COVID. The fact that these are so low to the baseline consistently all year demonstrates that they “stole” many pneumonia deaths that would have happened regardless of COVID and called them “COVID,” which errantly increased COVID death numbers drastically. Clearly there are excess deaths and something very deadly came into society. However, the total numbers are not consistent with all being from COVID.
Next, look at Figure 2 J18 Pneumonia in ages 18-54.

Figure 2
Comments:
In all 3 states, from 2015 through 2019, the peaks are not always in the winter. Seasonality does not seem to affect this age group 18-54, except upon the entry of COVID.
In spring 2020, Minnesota’s black line plot of all J18 Pneumonia involved deaths changed direction from going down to a summer lull to going up again, not as starkly as Massachusetts and Connecticut though, which shot up in their first COVID wave.
In the summer 2020, because of lack of seasonality, nothing much can be said for any of the 3 states.
In the fall of 2020, however, all 3 states began to rise well above the normal range bounded by the dashed gray lines. Something happened late in 2020, around November that cause a great number of younger people ages 18-54 to die involving J18 Pneumonia. And if you have read any of my other work, you know that November 2, 2020 is when the 20% add-on payment kicked in for remdesivir. After that, the kidney failure went high and the pneumonia deaths and COVID deaths went high. Why? Consider that someone goes to the hospital when they have a really bad chest cold like COVID. If they test positive for COVID, the hospital gets a big bonus for running remdesivir through their veins. And then they prepare the patient for ventilation because that is what the central authority says to do and hospitals must follow the central authority else face the consequences of Medicare or Medicaid payments being delayed or denied.
Note the breadth of the winter 2020/2021 wave. Remember that these are dead young people. Every pixel has a person’s name on it. These are people’s sons and daughters, brothers and sisters, friends, spouses, and some child’s parents.
The summer of 2021 did not come close to returning to baseline normal. Even though there is no seasonality in this age group, the summer of 2021 is noticeably high all summer.
Then, the massively high and wide wave of the fall/winter/spring 2021/2022 happened. Many extra souls were killed involving J18 Pneumonia. The dotted line that shows pneumonia without COVID indicates that all the excess pneumonia deaths involved COVID. Why? These 3 states are among the highest vaccinated population in age group in the United States. I don’t have time for the citation. Massachusetts and Connecticut are guaranteed top 5, and Minnesota is guaranteed well above national average.
Colossal Point
The colossal point of this article is that, after two waves of COVID, the third wave of ages 18-54 has the highest number of pneumonia deaths both per day and in total during the wave. This is negative efficacy, or it is hospital murders, or it is both.
Notice again in the younger age group how COVID was done killing people in March 2022. Why did the government not tell you this? Why did they pretend COVID is still deadly and killing people twice as long as the Spanish flu of 1918 and 1919. Why did they still have vaccine mandates knowing that the vaccine was not sterilizing and knowing that the vaccinated actually transmit COVID at least as much as the unvaccinated? Why did they lie about virtually everything to do with COVID?
Answer: because they could—other people will buy whatever fear the government sells them.
Conclusion
The older age group 75+ performed as one would expect—diminishing excess with each successive wave. The third wave is the smallest.
The younger age group 18-54 performed opposite to what one would expect—exceedingly more people died in the third wave than in the first or second waves.
There is strong evidence of negative efficacy of COVID vaccination or some other externality such as hospital drug and treatment protocols, especially if they found out someone was not COVID vaccinated.
Again, as I write and write and write, nothing will be known from just data. There must be forensic analyses of medical files to ascertain causality to a conclusive standard of proof. This is not expensive. It seems that government refuses to perform basic public health monitoring functions.
God Bless you all
The Furin Cleavage Site introduced to the SARS Coronavirus by the US Bioweapons labs causes Syncytia - the merging of your Lung cells to cause Viral Pneumonia.
Meng and coworkers showed that “Syncytium formation by the Omicron spike was substantially impaired compared with the Delta spike”.
https://geoffpain.substack.com/p/pneumonia-caused-by-wuhan-covid19
john your empathy is notable. we all pray record level data will soon be available.
the bodies and cause are there, and so is the perpetrator, but no one is held accountable, the great ethical lapse of our times.
Do you have any data on Idiopathic pulmonary fibrosis? related to vaxx?
why? becuasue I am hearing of a number of cases in my small NH Town...
thanks